Showing posts with label Sentiment indicators. Show all posts

Sunday, July 22, 2012

Short vs. Long ... Term: Andre Gratian's 7/22/12 Turning Points update

Andre Gratian gives a great overview of the bull vs. bear perspective on the stock market in his Market Turning Points update report (thanks again Andre!). This includes technical and sentiment analysis for the U.S. stock market; as well as the volatility index (VIX), the XLF (the financials ETF), bonds (TLT), the US dollar and the euro, gold, and crude oil. You can get more info about Andre's work at his website (including his intraday update subscriber series), at http://www.marketurningpoints.com/. And now, Andre's update (click any of his charts to see it as a larger image):

=============

July 22, 2012

Market Turning Points
Week-end Report

By Andre Gratian

SHORT-TERM VS. LONG-TERM
Precision timing for all time frames through a 3-dimensional approach to technical analysis: Cycles - Breadth - P&F and Fibonacci price projections, and occasional Elliott Wave analysis
“By the Law of Periodical Repetition, everything which has happened once must happen again, and again, and again -- and not capriciously, but at regular periods, and each thing in its own period, not another’s, and each obeying its own law … The same Nature which delights in periodical repetition in the sky is the Nature which orders the affairs of the earth. Let us not underrate the value of that hint." -- Mark Twain
Current position of the market

SPX: Very Long-term trend – The very-long-term cycles are down and, if they make their lows when expected (after this bull market is over) there will be another steep and prolonged decline into late 2014. It is probable, however, that the steep correction of 2007-2009 will have curtailed the full downward pressure potential of the 120-yr cycle.

SPX: Intermediate trend – SPX is in a limited intermediate uptrend which is estimated to end in the first week of August.

Analysis of the short-term trend is done on a daily basis with the help of hourly charts. It is an important adjunct to the analysis of daily and weekly charts which discusses the course of longer market trends.

Daily market analysis of the short-term trend is reserved for subscribers. If you would like to sign up for a FREE 4-week trial period of daily comments, please let me know at ajg@cybertrails.com.

Market Overview

From last week: “Should conditions remain as they are during this rally phase, the SPX would be expected to reach about 1380, and could even stretch to the low 1400s. Being able to overcome resistance around 1362 will determine whether or not these projections can be reached.”

Once again, the SPX obliged with the forecast of a week ago. When this prediction was made, the SPX stood at 1357.70 after a strong rally on Friday 7/13. This was seen as the resumption of an intermediate uptrend which had started from 1267 on 6/04, and was expected to reach 1380, at a minimum. In fact, last Thursday the SPX rose to 1380.39 before it started to retrace. By Friday, it became obvious that, after meeting its lower target dead on, the short-term trend had been interrupted and a correction had started.

This correction is not expected to be long-lasting and could end as early as 7/25, around 1345 max.
After that, an extension of the intermediate uptrend could take place, driving prices into the low 1400s
before ending sometime in early August.

That’s the forecast for the short-term. What about the long term? I have said all along that there will be a long-term correction (bear market) into the Kress 120-year cycle low which ideally bottoms in October 2014. While SPX, DJIA and NDX are attempting to keep alive their bull market trend from 2009, long-term deceleration is taking place in other indices and raising a red flag. This is evident in the broader NYSE index when compared to the SPX in the following charts (courtesy of Qcharts).

Chart analysis

There is no question that the broader index is relatively weaker than the SPX. Both indices made similar recovery highs from their March 2009 lows, and comparable weakness took place in both during the subsequent correction which ended in October 2011. It is in the price action during the next rallies into March 2012 that we start seeing long-term deceleration asserting itself in the NYSE. While SPX went on to surpass its May 2011 peak, the NYSE fell far short of it before starting to decline again. The same thing happened on a smaller scale last week. SPX made a marginal new high, but NYSE did not.

In order to make this long-term divergence more graphic, I have drawn trend lines across the May 2011 and March 2012 peaks of both indices. This shows that the SPX, having made a higher high, is still in an uptrend, while the NYSE which made a lower high, is already in a potential long-term downtrend. The relative weakness of the NYSE suggests that fewer stocks are participating in the bull market. These stocks are the small caps and this relative performance is best expressed in the following chart of the Russell 2000 (small caps) vs. Russell 1000 (large caps) -- courtesy of StockCharts.com-- which gives you essentially the same picture as the one above, but is more explicit in that it shows the small caps underperforming the large caps. Historically, this has been a negative for the market, foreshadowing the advent of a bear market if it persists.


Is it time to panic and sell everything you own? Not necessarily, and this is probably the mistake that the permabears are making in thinking it is. Some Elliott Wave analysts fall in that category. They believe that we have already started a bear market and that there is a devastating wave 3 just ahead. They are probably right, but their timing could be off.

Based on cycles, there are two time frames in which the market could start a vicious decline. One is relatively nearby, as close as mid-August. If this time frame fails to trigger something substantial, then the day of reckoning will probably be put off until the first quarter of 2013. Why don’t we wait and see which one the market chooses?

For analysis of the short term, we’ll turn to the Hourly Chart of the SPX. The blue trend line represents the “long” intermediate trend from October 2011. The green trend line connects lows from 1267 and denotes the “short” intermediate trend. For now, both trends are still rising, but after 5 waves from the low, the SPX appears to have given a short-term sell signal. This is reflected in the price action, and is even more apparent in the indicator which showed some divergence at the top prior to breaking its trend line.

So far, the index has retraced to a very strong support level around 1360, and it may have a bounce before going lower. The chart shows that prices held above support for four hours without penetrating it and it would not be surprising to see an attempt at resuming the uptrend on Monday morning. However, short-term cycles due to make their lows around 7/25 should pull the index down below the support line, perhaps as far as 1346, which is a reasonable projection according to the P&F chart. Whether or not these cycles will be strong enough to propel the SPX back in an uptrend remains to be seen, but since the next top is expected around early August, it’s possible.


Cycles

From last week -- and still pertinent -- is this quote: “A minor cycle is due Tuesday, and another one around the 20th. Over the short term, the most important cycles will form a cluster in the second week of August. At this time, they are expected to bring about a high, but should they bring a low instead, it would make a big difference in the trend pattern.”

A short-term reversal occurred on Friday 20th, so the market obliged in time as well as in price.

The only thing to add for the short-term is that, as mentioned above, minor cycle lows are expected around the 25th.

Breadth

Below is the NYMO (McClellan Oscillator) superimposed on the NYSI (McClellan Summation Index; both courtesy of StockCharts.com).


If there was anything that was forecasting a near-term reversal, it was breadth. Look at the action of the NYMO last week while the market was making new intermediate highs. It’s difficult to find more striking negative divergence. But that has not been followed by a great deal of weakness – at least not yet! The index has only returned to neutral and we’ll have to see what the next few days bring.

It’s obviously not a time to get too bullish. Take a look at the NYSI. Not only is it beginning to flatten out, an indication that the intermediate trend may be about to reverse, but look at the RSI, which is just about as overbought as it gets. A cautionary stance is appropriate.

Sentiment Indicators

While some indicators are exerting caution, when we look at the SentimenTrader (courtesy of same) it’s very difficult to get overly bearish about the stock market. This index has an excellent record of predicting important highs and lows and – unless it is totally blowing it, this time – it only shows that sentiment is neutral, contradicting those that are predicting gloom and doom.


The VIX (volatility index)

Below, we compare the SPX to the VIX (charts courtesy of Qcharts) with the help of weekly charts. Since the beginning of the bull market of March 2009, the up-phases in the SPX have been matched by down-phases in the VIX. I have drawn channel lines around both to make this more obvious. What is currently shown is that the SPX’s uptrend is matched by a downtrend in the VIX, with the latter making a new low and dropping below 16 on Thursday. Before we can call for a major top in the market -- which, granted, may already have taken place at 1422 – we would first need to see both indices get outside of their intermediate channels, and then break their long-term trend lines. Even then we still would not have a confirmed long-term downtrend. Both would have to overcome their respective former intermediate low and high. Only then could we say for sure that we have started a bear market.

Of course, I am not advocating that you wait for such a confirmation to take precautionary measures, but let’s at least see if there are other warning signs ahead of us beyond some trend deceleration!


XLF (Financial SPDR)

I have mentioned a number of times that XLF is usually a good leading indicator. It certainly proved my point this time. The index stalled before making a new high while the SPX was overcoming its previous peak. This was a case of clear negative divergence in the XLF, although it was a little confusing because this is one time when the VIX actually misled us at the top of a short-term trend. Not visible on the weekly chart (above) but on Thursday, the VIX closed on its low of the day, suggesting that the SPX would try to go higher on Friday. There was no such ambiguity in the XLF. It clearly warned of a reversal.

The XLF also gave a warning on an intermediate basis when it refused to make a higher high on 4/01, while the SPX did. Now we have divergence on a shorter time frame as well. These are not bullish signs.


BONDS

TLT continues to defy gravity, seemingly ignoring what the SPX is doing. A week ago, it made -


a new fractional high before pulling back a couple of points, but it was right back at its high as soon as the market started to correct.

Last week, I mentioned that if TLT was able to get past 130 decisively, it should be able to get up to 136-137 according to its P&F chart. This is still a valid projection.

UUP (Dollar ETF) Daily Chart

The relationship between leading/confirming indicators and the SPX is not always clear and uniform. We are going through such a period, right now. That the SPX has started a correction is clear enough, and UUP is one of the indices that confirms it. I have expected UUP to next make a move to about 23.30, and it may now have the opportunity to do so. It would not take much for it to advance to a slightly new high, but for that, it would probably need the Euro to continue its downtrend, and the Euro may not want to do that! Although it made a slightly new low on Friday, the Euro appears to have essentially met its intermediate projection and is likely to resist further selling.

On Friday, UUP came within 8 cents of its former high. Let’s see if the Euro gives it the latitude it needs to keep going.


GLD (ETF for gold)

GLD continues to trade sideways, attempting several times to break above a declining secondary trend line, but failing to do so. However, the longer it resists getting severely pushed back by that trend line, the more likely it is to go through it at some point.

The 25-wk cycle which bottomed 4 weeks ago has provided support above a former low, but has not been able to force prices through the secondary trend line. This may change over the next two or three weeks if the market has a final rally into early August. If GLD can overcome its trend line, it can move at least to 159/160 during this time period. That would fall short of challenging the main downtrend line and could be all the upside we get before the intermediate correction resumes its downward course.


USO (United States Oil Fund)

After a protracted decline which created an extremely oversold condition, USO is rallying after meeting an interim phase objective. The index could pause here, but has the potential of moving up -


to about 36 before running into overhead resistance. It has already rallied 50% of its last phase decline and, at 36, would make it a .618 retracement. This is also where it would run into its 200-DMA. New lows are likely to follow this rally as USO appears to have resumed its long-term downtrend from its high of 119.17 on 7/06/08.

FXE (Euro Trust ETF)

As a consequence of severe political and economic difficulties experienced by the Eurozone, the Euro has been in a severe decline since its high of May 2011. However, there are important signals suggesting that this decline may be coming to an end -- at least temporarily. Positive divergence is showing in the weekly, daily, and hourly indicators, and FXE has met an intermediate projection, which suggests that it is more likely to find support in this area than to continue declining.

This fits in with the market position which calls for a rally extension into the first week in August before the intermediate top is achieved. There is a strong correlation between strength in the Euro and strength in the stock market.


Summary

The SPX has started to correct after making a minimal higher high in the rally which started at 1267 on 6/04. After a minor correction, it is expected to move higher over the next three weeks, perhaps reaching the low 1400s.

A survey of various market components reveals a less than bullish picture. Storm clouds are gathering which call for caution after this rally is over. The question is whether the atmospheric disturbance due at that time will only be a tropical depression or a full-blown, type 5 hurricane. In either case, precautionary measures should be taken until the strength of the disturbance can be assessed.

Andre

FREE TRIAL SUBSCRIPTON


Market Turning Points is a service which is uncommonly dependable and reasonably priced providing intra-day market updates with comments and explanations, plus a daily summary and a weekly report. My service is ideally suited to traders, but it is also valuable to longer-term holders since price projections are provided using Point & Figure analysis, along with best-time estimates obtained from cycle analysis.
For a FREE 4-week trial, Send an email to: ajg@cybertrails.com
For further subscription options, payment plans, and for important general information, I encourage you to visit my website at www.marketurningpoints.com. It contains summaries of my background, my investment and trading strategies, and my unique method of intra-day communication with subscribers. I have also started an archive of former newsletters so that you can not only evaluate past performance, but also be aware of the increasing accuracy of forecasts.

The above comments about the financial markets are based purely on what I consider to be sound technical analysis principles. They represent my own opinion and are not meant to be construed as trading or investment advice, but are offered as an analytical point of view which might be of interest to those who follow stock market cycles and technical analysis.

Sunday, July 15, 2012

Stock market staying in the game: Andre Gratian's 7/15/12 Turning Points report

Could the stock market have enough strength to go higher? Let Andre Gratian guide you on that and other financial assets and markets, with his expert blend of technical analysis, cycles interpretation and inter-market comparisons (thanks again Andre!). Below is his Market Turning Points update report for the U.S. stock market; as well as the volatility index (VIX), the XLF (the financials ETF), bonds (TLT), the US dollar, gold, and crude oil. You can get more info about Andre's work at his website (including his intraday update subscriber series), at http://www.marketurningpoints.com/. And now, Andre's update (click any of his charts to see it as a larger image):

=============

July 15, 2012

Market Turning Points
Week-end Report

By Andre Gratian

RESUMPTION OF UPTREND UNDERWAY
Precision timing for all time frames through a 3-dimensional approach to technical analysis: Cycles - Breadth - P&F and Fibonacci price projections, and occasional Elliott Wave analysis
“By the Law of Periodical Repetition, everything which has happened once must happen again, and again, and again -- and not capriciously, but at regular periods, and each thing in its own period, not another’s, and each obeying its own law … The same Nature which delights in periodical repetition in the sky is the Nature which orders the affairs of the earth. Let us not underrate the value of that hint." -- Mark Twain
Current position of the market

SPX: Very Long-term trend – The very-long-term cycles are down and, if they make their lows when expected (after this bull market is over) there will be another steep and prolonged decline into late 2014. It is probable, however, that the steep correction of 2007-2009 will have curtailed the full downward pressure potential of the 120-yr cycle.

SPX: Intermediate trend – SPX is back in an intermediate uptrend.

Analysis of the short-term trend is done on a daily basis with the help of hourly charts. It is an important adjunct to the analysis of daily and weekly charts which discusses the course of longer market trends.

Daily market analysis of the short-term trend is reserved for subscribers. If you would like to sign up for a FREE 4-week trial period of daily comments, please let me know at ajg@cybertrails.com.

Market Overview

The short-term correction of the SPX that had been underway since 7/03 came to an end on Thursday, at 1325.41, a few points lower than anticipated (1330-32), and a couple of days earlier (7/17), but still well within the price and time parameters that had been forecasted. The resumption of the uptrend was punctuated by a strong rally which has already exceeded thirty points, with enough initial momentum to suggest that higher prices are more than likely, but probably not without a near-term correction that would neutralize the short-term overbought condition.

The odds that this rally will take prices to a new intermediate high (from 1267) will increase if the index can rise above the 1362 resistance, ideally this coming week. If it does, the rally should continue into the first week in August, after which we should be prepared for a potentially important period of weakness which could last into October.

The above is an outline of the scenario that I am proposing for the next few weeks. Of course, it will be adjusted as we move along to reflect a possible change in trend. In non-EW lingo, from the 1267 June low, the market is embarking on a 5th uptrend phase. Normally, the completion of a fifth phase is followed by a correction. We should be able to estimate the depth of the correction by the amount of distribution that occurs at the top of the move.

If we have the tools to discern the changes in supply/demand, and whether the battle ground where buyers and sellers fight for supremacy are areas of accumulation or distribution, we should not be surprised by the direction of the trend. Only events that are totally unexpected -- such as the assassination of president Kennedy in 1962 -- can produce an unforeseen change in trend, and then, only temporarily.

Should conditions remain as they are during this rally phase, the SPX would be expected to reach about 1380, and could even stretch to the low 1400s. Being able to overcome resistance around 1362 will determine whether or not these projections can be reached.

Let’s look at some charts.

Chart analysis

This is a Daily Chart of the SPX under which I have placed a comparable chart of the NYMO. This gives us an excellent appraisal of the current trend.


There is nothing on this chart that already suggests that the index cannot meet the price projections given above. The last short-term high was achieved with negative divergence developing only in the MACD histogram. That was an indication that a short-term correction was imminent, but it did not reflect on the longer-term trend from 1267. So far, breadth support has been more than adequate. At the last near-term top, the NYMO went to its most overbought level in three years and needed to correct. When it did, it barely went negative before turning up once again on Friday.

During the current rally, we would expect to see divergence appear in both the MACD and the NYMO, and the only condition that has been set for the SPX, is that it must trade decisively above 1362. If it fails to do so, it would be a warning that the above scenario has to be altered.

The Hourly Chart demonstrates the strong momentum displayed by the initial break-out of the downtrend. How we progress from here will tell us if this is just a blip of short-covering, or something more lasting. As long as we do not lose too much of that early momentum in the next near-term correction, we’ll be OK. The main obstacle to fulfilling the scenario depicted above is the red line drawn at the 1362 level. It is the level that stopped the first phase from 1267. Clearly, we need to get past it – preferably by the end of the week -- in order to meet our deadline of early August for an intermediate top.

Should we break the uptrend line (from 1267) before the end of the month, we would be making a significant alteration in the trend pattern of the SPX. Cycles due around August 6 are expected to bring about a top. If they bring a low instead, we would have to change our expectations for what lies ahead.


Cycles

The cycle which was due on 7/13-7/17 chose to make its low one day early, on the 12th. It caused a short-term climax in the market early in the day, but most of the losses were recouped by the close.

A minor cycle is due Tuesday, and another one around the 20th. Over the short term, the most important cycles will form a cluster in the second week of August. At this time, they are expected to bring about a high, but should they bring a low instead, it would make a big difference in the trend pattern.

Breadth

I have already shown the NYMO (courtesy of StockCharts.com) above. Here is the NYSI (the Summation index). It represents the intermediate trend of the A/D. As you can see, it is not as bullish as the NYMO. It is beginning to curl over, and its RSI and MACD are both overbought. But, since it is made up of the daily readings of the McClellan oscillator, we will focus our attention on the latter and give this index a little bit of slack. We’ll review it again next week.


Sentiment Indicators

Since we are approaching a time of uncertainty for what lies ahead in the market, this week we’ll look at the SentimenTrader (courtesy of same) to see what it’s telling us.


Actually, not much! It is slightly negative for the market in the near term, which matches our expectations for the next couple of days, but the long-term signal is just a little bit on the positive side of neutral. According to this indicator, it does not look as if anything of importance is going to happen over the foreseeable future.

The VIX (volatility index)

The chart pattern made by the VIX (courtesy of Qcharts) continues to be bullish with no expectation of market negativity at this time. This supports the scenario which was traced out in the opening remarks. No storm clouds ahead!


XLF (Financial SPDR)

The third index that I use as a leading indicator gives us the same picture. It is more bullish than the SPX over the near-term and has already overcome the comparable 1362 level but, since it showed some negative divergence to the SPX at its last two intermediate tops (April 2012 and May 2011), we’ll need to keep a close watch on this index in early August. If negative divergence appears once again, it could be an indication that another intermediate decline lies ahead.


BONDS

The SPX has been in a weak uptrend since early June, but in an uptrend nevertheless. And so has TLT, after briefly consolidating. Actually, TLT started its uptrend in March, which was normal enough -


since this is when the SPX started its correction into the June low. But instead of retracing when the SPX reversed at 1267, it only went sideways for a little while, started to move up again and is now challenging its former high.

If it should make a new high, it could continue rising to 137. However, if the SPX extends its uptrend into the first week in August, it is more than likely that TLT will stop where it is and continue its consolidation before moving higher.

UUP (Dollar ETF) Daily Chart

UUP has been in a shallow intermediate uptrend ever since it found support at the bottom of a long-term downtrend channel that goes back to late 2009. In spite of this steady move upward, it is still confined to that channel and would have to get past 26, at a minimum, to break out of it. That does not seem likely in the near future. The current uptrend is clearly corrective and will most likely be followed by another intermediate downtrend after it has reached its 25+ projection. The base which was built between September and November 2011 is not extensive enough to move it out of its long-term down channel at this time.

Over the near-term, UUP made a new high, but only by a fraction. That may be all it is capable of for now. The Euro Trust (FXE), may be in the process of reversing its intermediate downtrend. By trading at 121.07 on Thursday, it has met an important projection that could end its decline from May 2011. 121.07 was re-tested later that day, and again on Friday. A process of accumulation with limited price appreciation could now take place. Should that happen, it is unlikely that the SPX will experience much weakness in the near future – which is what some of the above indicators are also saying.


GLD (ETF for gold)

GLD continues its intermediate correction and does not seem very anxious to end it. The 25-wk cycle recently made its low but it has not brought anything resembling the reactions to the previous lows.

There is a possibility that it could move up to 162 before continuing its correction but its time span to do this is limited to the next 2 or 3 weeks. If it has not done it by then, a new low is almost assured -- especially if the SPX starts a correction that extends into October.


OIL(USO)

The oil complex is of little interest at this time. Long-term weakness has set in. USO had a sustained decline to the level of a former low where it found temporary support and has started a holding pattern from which it could move a little higher, but the upside potential is limited while the downside risk is consequential.


Summary

The SPX appears to be in a corrective uptrend which is slated to end by the first week in August, or possibly earlier. That is leading some EW theorists to forecast that a major decline will follow.

Perhaps, but I cannot find any market sign that would justify such expectations. One example is the neutrality exhibited by the SentimenTrader. At the beginning of important downtrends, it is positioned deeply in the red zone.

Even more significant, the Euro Trust (chart below) appears to have completed the decline which it started in May 2011. An important projection has been filled at the same time that positive divergence is appearing in the weekly indicators. This is also the completion of a 5-wave pattern. Granted, it may not be ready to soar upward, but nor does it look capable of declining to much lower lows right away.


Andre

FREE TRIAL SUBSCRIPTON

HOW GOOD ARE YOU?
I challenge you to sign up for an introductory, four-week subscription now, and compare your market forecasts to mine! I will e-mail on-going, intra-day market updates with comments and explanations, plus summaries of the daily action and a weekly report. My service is ideally suited for traders, but it is also valuable to longer-term holders since price projections will be provided to you through Point & Figure analysis (which pin-points the probable extent of market moves) along with best-time estimates obtained from cycle analysis.

This is the unsolicited opinion that a trial member recently expressed about my service:

Dear Trial and current subscribers,

I have traded options for almost 17 years. I've tried many services for real time analysis for market trends up or down. Sounds simple, but it isn't. The trail is littered with wrong analysis. I gave Andre a try and it was the best decision I made. In my two option trades with Andre, I netted over $9,000 profit, the last trade especially, his timely signal on the SPX saved me from losing all my profit had I held 30 minutes longer.


Vinnie St. John
Davie, FL

ARE YOU AS SUCCESSFUL AS YOU COULD BE? Fear or your ego may be getting in the way. Verify your own research! You may happily discover that there is a service which is uncommonly dependable and also reasonably priced…called Market Turning Points.
For a FREE 4-week trial, Send an email to: ajg@cybertrails.com
For further subscription options, payment plans, and for important general information, I encourage you to visit my website at www.marketurningpoints.com. It contains summaries of my background, my investment and trading strategies, and my unique method of intra-day communication with subscribers. I have also started an archive of former newsletters so that you can not only evaluate past performance, but also be aware of the increasing accuracy of forecasts.

The above comments about the financial markets are based purely on what I consider to be sound technical analysis principles. They represent my own opinion and are not meant to be construed as trading or investment advice, but are offered as an analytical point of view which might be of interest to those who follow stock market cycles and technical analysis.

Sunday, July 1, 2012

Correction still, or done? & look at China: Andre Gratian's 7/1/12 Turning Points update

The markets still have surprises in store, and Andre Gratian shows you what you need to know for the U.S. stock market, plus a look at China; as well as the financial sector volatility index (VIX), the XLF (the financials ETF), bonds (TLT), the US dollar, gold and oil in this Turning Points update (thanks again, Andre!). You can get more info about Andre's work at his website (including his intraday update subscriber series), at http://www.marketurningpoints.com/. And now, Andre's update (click any of his charts to see it as a larger image):

=============

July 2, 2012

Market Turning Points
Week-end Report

By Andre Gratian

INTERMEDIATE LOW CONFIRMED
(Corrective pattern ?)
Precision timing for all time frames through a 3-dimensional approach to technical analysis: Cycles - Breadth - P&F and Fibonacci price projections, and occasional Elliott Wave analysis
“By the Law of Periodical Repetition, everything which has happened once must happen again, and again, and again -- and not capriciously, but at regular periods, and each thing in its own period, not another’s, and each obeying its own law … The same Nature which delights in periodical repetition in the sky is the Nature which orders the affairs of the earth. Let us not underrate the value of that hint." -- Mark Twain
Current position of the market

SPX: Very Long-term trend – The very-long-term cycles are down and, if they make their lows when expected (after this bull market is over) there will be another steep and prolonged decline into late 2014. It is probable, however, that the steep correction of 2007-2009 will have curtailed the full downward pressure potential of the 120-yr cycle.

SPX: Intermediate trend – SPX is probably putting the finishing touches on an intermediate-term bottom.

Analysis of the short-term trend is done on a daily basis with the help of hourly charts. It is an important adjunct to the analysis of daily and weekly charts which discusses the course of longer market trends.

Daily market analysis of the short term trend is reserved for subscribers. If you would like to sign up for a FREE 4-week trial period of daily comments, please let me know at ajg@cybertrails.com.

Market Overview

By holding above 1305 and rallying, the SPX confirmed the 1267 low as an intermediate bottom. Friday’s surge took the index to the highest level of that three-week period and suggests that it may now be in a position to re-test the May high of 1415 before the move comes to an end. What follows will be closely monitored, because it could turn out to be an important top.

Several questions were answered by last week’s market action. The distribution pattern that had been created at the 1363 high had produced a projection down to 1305/1310 which was met last Monday when the SPX traded at 1309.27. That level was re-tested on Thursday, and the subsequent rise above 1334 on Friday ensured that the trading that had taken place above 1305 was accumulation and not distribution. It also laid to rest the possibility that the 2-yr cycle was still ahead of us and could drive prices lower.
The trigger for the surge which started on Thursday was the news that the Eurozone had made some tangible progress in its attempt to resolve its economic problems. The buying/short-covering rally has enough momentum to initially carry the SPX to about 1374/1377 and, after a minor correction, probably push higher to the low 1400s. What happens after that could be of concern, because there are already some indications that an important top could materialize at that time. But we don’t have to dwell on that right now since we still have a few weeks before we need to make that evaluation. Our immediate task is to track the rally to see if it has the potential of reaching the objectives that we have set for it.

Chart analysis

As the Daily Chart shows, the short-term and intermediate trends were clarified on Friday when the SPX rallied strongly to extend the move which it started on 6/04 from 1267. After breaking out of a short-term down-channel, the index found resistance at the top of a larger channel and retraced a little more than 50% of its uptrend before finding support. Friday’s surge has already taken it near the top of that channel in a challenge of its previous high.

The base established on the P&F chart gives the initial spike a projection to 1374-1377, a level which roughly corresponds to the top of the green channel. Resistance at that level should cause it to have a minor correction, perhaps similar to the one which occurred in mid-course during the first phase of the rally. After this pull-back, the SPX should be able to rise to its ultimate intermediate destination -- slightly above 1400.


If the first market correction from 1422 is construed to be a 5-wave pattern, and if the rally which is currently taking place ends up being a corrective phase, we should be prepared for the possibility that a serious decline will follow. Let’s not forget that we are expecting a great deal of weakness into late 2014 as a result of the bottoming 120-year cycle. With the pattern which is currently under construction, it is possible that 1422 will turn out to be the top of the next bear market.

Let’s now turn to the Hourly Chart for an analysis of the near-term trend. Friday’s surge retraced the entire length of the near-term correction all at once and took the SPX to the top of its intermediate channel. It would not be surprising if the resistance at this level caused some consolidation but it is more likely that the initial momentum will carry it to its 1374/77target before it pulls back.

The strength of the move had caused the indicator to reach an overbought level, but it has already somewhat corrected that condition and may be ready to take the index to its interim near-term target.


Cycles

The resumption of the rally from 1267 has put to rest the view that the 2-yr cycle low might still be ahead of us. It now appears that it bottomed in early June and is the basic cause of the current rally.

The mid-June top was caused by a small cluster of cycles. This action could be repeated in early August when more important cycles are due which could cause a more important top.

Breadth

The NYMO and NYSI (courtesy of StockCharts.com) are shown below.
During the pull-back into last Monday, the NYMO corrected but remained positive and in an uptrend. This has caused the NYSI to extend its own uptrend. Until we see a reversal of this trend, we can expect the stock market rally to continue. The RSI has barely reached overbought and, as we can see from its past action, it can stay in that condition for some time. When it starts to turn down, it will be a warning that a correction is due.


Sentiment Indicators
The VIX


On the chart below (courtesy of Qcharts) we see that the VIX never confirmed the downtrend in the SPX and remained in a downtrend itself in a well-defined channel. The closest it came to confirming it was on Thursday when it touched the top trend line, but it could not go through and reversed immediately when the SPX began to rally. It is now in perfect sync with SPX, closing near its low while the SPX closed near its high. It is likely that it will make a new low if the latter makes a higher high.

On Friday, VIX touched 17 and closed at 17.08. Its P&F chart gives it a potential move down to 14. When it gets there and begins to show some divergence to the SPX, it will be time to look for an end to the market rally.


XLF (Financial SPDR)

There is very little difference between the hourly chart of XLF and that of the SPX. If anything, the XLF chart is a trifle more positive because, on Friday it closed fractionally above its mid-June high. This is another indication that the market rally probably has farther to go.

This positive divergence is even more pronounced when we compare the Dow Jones Industrials to the Dow Jones Financial index. That was not the case when the DJIA made a new high on 5/01. At that time, the DJ Financials failed to make a new high by a good margin, thereby forecasting a reversal in the DJIA.

The resemblance between XLF and SPX extends to their indicators. The patterns are practically identical. Both gave a buy signal at the same time, and both are in an uptrend. When they start to diverge, it will be time to look for a correction.

The reason I show a chart of the XLF is because, like the VIX, it tends to warn of impending reversals in the SPX. I expect XLF to give a warning that SPX is approaching the end of its rally by showing some negative divergence to the latter.


BONDS

Below is a weekly chart of TLT. It is in a solid long-term uptrend which shows no sign of ending. A few weeks ago, the index made a new high, pulled back to the level of the former high, and has traded sideways for four weeks without violating that support. The overall action probably means that we should take the Fed chairman at his word, and that interest rates will be held at their current level for a couple more years.


UUP (Dollar ETF) Daily Chart

The sharp rally experienced by the Euro on Friday caused UUP to back off proportionally, but it has not altered its long-term uptrend, nor is it expected to do so anytime soon. The Point & Figure chart of this index formed a base between May and September of last year which gives it a projection to 25. This is equivalent to a move up to 90 for the dollar.

If the proposed scenario for the SPX is correct, the current correction in UUP should continue until the first week in August, after which it should resume its long-term uptrend.


GLD (ETF for gold)


GLD (daily chart above) has been correcting for nine months and, if it does not take advantage of the 25-wk cycle -- which just made its low and should exert some upward pressure -- to climb above its long-term downtrend line, gold bulls may have to wait until November for the next opportunity to resume the long-term uptrend (most likely from a lower level).

Near term, since GLD is essentially in sync with the SPX, we could expect it to join the latter in an uptrend which has a potential target of 161/162.

OIL(USO)

We’ll get a better feel for what oil is doing if we look at a weekly chart of USO going back to its 2008 top. This is a very weak index and, considering its lack of participation in the bull market which started in 2009, it is very likely that USO is on its way to much lower prices before it reaches a long-term bottom. I mentioned in a previous article that the P&F chart calls for a potential low at about 8.
When you look at this chart, you can see that the target is not as far-fetched as it first sounds.


FXI (iShares China 25 ETF)

I want to show you one more chart which could shed some light on where the SPX may be heading in a few weeks. We know that some Eurozone countries have serious economic problems that are already weighting heavily on their stock markets, some of which are already in bear trends.

Another country which can have a major impact on the world’s economy is China. It has started to show deceleration in its rate of growth and, since China is a big consumer of commodities, this has already had a significant impact on the commodity index which started to decline when the FXI made its bull market high in early 2011.

FXI is currently quite a bit weaker than the SPX and, like some of the Eurozone markets, already seems to be in a bear trend. It would appear that the bottoming 120-yr cycle is already affecting some major stock markets and that it’s only a matter of time before SPX joins them in a protracted decline. This is why it will be important to continue monitoring the FXI and the European markets, and to keep a close eye on what SPX does after it comes to the end of its intermediate uptrend (probably in early August).


Summary

From last week: "The near-term direction of the stock market will, to some extent, depend on what is decided at the Eurozone summit scheduled for next Thursday and Friday.

The agreement reached by summit participants had a significant impact on the market, propelling the SPX to a 33-point surge on Friday. This initial momentum should extend the rally from 1267 for another few weeks. When it ends -- probably in early August – we should consider the possibility that the index will be ready to resume the decline which it started from 1422.

Andre

FREE TRIAL SUBSCRIPTION

HOW GOOD ARE YOU?
I challenge you to sign up for an introductory, four-week subscription now, and compare your market forecasts to mine! I will e-mail on-going, intra-day market updates with comments and explanations, plus summaries of the daily action and a weekly report. My service is ideally suited for traders, but it is also valuable to longer-term holders since price projections will be provided to you through Point & Figure analysis (which pin-points the probable extent of market moves) along with best-time estimates obtained from cycle analysis.

ARE YOU AS SUCCESSFUL AS YOU COULD BE? Fear or your ego may be getting in the way. Verify your own research! You may happily discover that there is a service which is uncommonly dependable and also reasonably priced…called Market Turning Points.
For a FREE 4-week trial, Send an email to: ajg@cybertrails.com
For further subscription options, payment plans, and for important general information, I encourage you to visit my website at www.marketurningpoints.com. It contains summaries of my background, my investment and trading strategies, and my unique method of intra-day communication with subscribers. I have also started an archive of former newsletters so that you can not only evaluate past performance, but also be aware of the increasing accuracy of forecasts.

The above comments about the financial markets are based purely on what I consider to be sound technical analysis principles. They represent my own opinion and are not meant to be construed as trading or investment advice, but are offered as an analytical point of view which might be of interest to those who follow stock market cycles and technical analysis.

Sunday, June 17, 2012

The Dow index leads stock markets rally-for how long? Andre Gratian's 6/17/12 Turning Points update

Isn't it great to have such good navigation on where the stock market is heading? We've had remarkably prescient forecasting and now you get more. Here's the new Turning Points update from Andre Gratian covering stocks, particularly levels in the S&P 500 and today the Dow Jones Industrial Average (DJIA, $DJI or $INDU); plus the volatility index (VIX), the XLF (the financials ETF), bonds (TLT), the US dollar, gold and oil (thanks again, Andre!). You can get more info about Andre's work at his website (including his intraday update subscriber series), at http://www.marketurningpoints.com/. And now, Andre's update (click any of his charts to see it as a larger image):

=============

June 17, 2012

Market Turning Points
Week-end Report

By Andre Gratian

DJIA leads rally higher - FOR HOW MUCH LONGER?
Precision timing for all time frames through a 3-dimensional approach to technical analysis: Cycles - Breadth - P&F and Fibonacci price projections, and occasional Elliott Wave analysis
“By the Law of Periodical Repetition, everything which has happened once must happen again, and again, and again -- and not capriciously, but at regular periods, and each thing in its own period, not another’s, and each obeying its own law … The same Nature which delights in periodical repetition in the sky is the Nature which orders the affairs of the earth. Let us not underrate the value of that hint." -- Mark Twain
Current position of the market

SPX: Very Long-term trend – The very-long-term cycles are down and, if they make their lows when expected (after this bull market is over) there will be another steep and prolonged decline into late 2014. It is probable, however, that the steep correction of 2007-2009 will have curtailed the full downward pressure potential of the 120-yr cycle.

SPX: Intermediate trend – SPX is probably putting the finishing touches on an intermediate-term bottom.

Analysis of the short-term trend is done on a daily basis with the help of hourly charts. It is an important adjunct to the analysis of daily and weekly charts which discusses the course of longer market trends.

Daily market analysis of the short term trend is reserved for subscribers. If you would like to sign up for a FREE 4-week trial period of daily comments, please let me know at ajg@cybertrails.com.

Market Overview

In the last newsletter, I wrote the following: “There are three potential projections. The most conservative is 1333. The next, which is moderate, is 1343. And there is an optimistic target of 1353. Since all of them exceed the high of 1329 which has already been reached, the odds favor a move past that level with the SPX deciding which target it wants to honor.”

After reaching its conservative projection of 1333, SPX consolidated for a brief period and resumed its uptrend last Thursday. By Friday’s close, it had met its moderate projection of 1343 and, in the process closed slightly outside of its correction channel and triggered a buy signal in the daily momentum indicators. The break-out move was fueled by expectations that this week-end’s Greek elections would bring positive results and that central banks were ready to act to assist a weakening Eurozone economy.

Whether the SPX pushes immediately toward its next target of 1353 or consolidates first should be known by Monday’s opening. It is normal for some profit-taking to occur after a projection is reached. This is what happened after we met the first target of 1333, and it may take place again at 1343 before moving higher. 1343 also represents a 50% retracement of the correction which started at 1422. Even if another consolidation does occur at this level, the increased momentum of the daily indicators suggests that the most liberal target has a good chance of being filled. And then what?

That will depend on whether the 2-yr cycle bottomed on 6/04, or whether its low is still ahead. If it has already made its low, it would be on the earliest date since 1992. Normally, the bottom occurs in the month of July, and it has occasionally extended into August. That, and the fact that we should get a decent pull-back after reaching 1343 or 1353 enhances the odds that its low will occur over the next 2 or 3 weeks.

Although the DOW and the SPX have shown good upside momentum over the past two days, this enthusiasm has not been shared by a number of other indices that I use as leading and confirming indicators. The most obvious of these is the Russell 2000 which is still trading below its 200-DMA and within its correction channel. Another is TLT which is still showing good strength and even went up on Friday instead of down. But the most important index which is flashing dissenting signals is VIX. In order to confirm the break-out by DJIA and SPX, it should have traded below 20 on Friday. Instead, its intraday low was only 20.61, and it closed at 21.11. In my view, this constitutes a non-confirmation of the move by the two bullish indices, and it requires some caution going into Monday. Perhaps it’s only a delayed reaction by the VIX and the other laggards, but it’s a warning that we should wait for a concerted confirmation that we have, indeed, made an intermediate low.

Chart analysis

Instead of starting with the SPX, let’s compare the Dow Jones industrials to the transportation index (Charts courtesy of QCharts). There is no question that the Industrials are stronger. The DJIA made a new high on 5/01 while the Transportation index did not. That constituted a double non-confirmation according to the Dow Theory. Not only did the Tran fail to make an intermediate new high along with the DJIA, it also failed to make a new bull-market high along with the Industrials on 4/02. That, in itself, is a potential red flag for the long-term.


But what about now? Same situation! The DJIA is stronger over the near-term and the Tran is not confirming this strength. I don’t know if the Dow Theory extends to short-term trends, but even if it does not, this is one more index which is not confirming the “break-out”. It is perhaps worth noting that the Dow Composite and Financial indices are both very similar to the Industrials.

As for the DJIA, Friday’s strength did not put it outside of its corrective channel, but it did bring it to the lower level of the overhead resistance which extends to the former high. Two other matters of interest: the first is the fact that the MACD (which did NOT show positive divergence at the low) is still negative and will soon reach the zero line. After becoming very oversold, there is a tendency for this index to consolidate around the zero line before it goes positive. The other is that it has reached -- or is about to reach – the time frame designated by the dark blue asterisk which marks the end-phase of a 7-week cycle which has recently been very consistent at indicating a short-term high.

Let’s move on to the Hourly SPX chart which shows clearly the attempt at breaking out by going past the former highs and the channel line. Did we just break a neckline? We can’t ignore the potential inverse Head & Shoulders which has formed, but we also know that many of these patterns morph into something else, so we’ll need some confirmation that the SPX is making this bullish pattern.

There is not much more to see on this chart, except that the index may have completed 5 minor waves from Thursday’s low and may be ready to retrace. This would be substantiated by the fact that the index is clearly diverging on that fifth little wave. That divergence is even more apparent in the A/D oscillator (not shown here). This matter should be resolved on Monday by either following through on the upside, or backing off immediately.


Cycles

The ambivalence about the mid-June cycles is no longer an issue. They should bring about a high and not a low.

The 2-yr cycle is still definitely an issue, but it should be resolved shortly, possibly by Wednesday, depending on the statement that will be made by the FOMC.

Beyond that, the same 7-wk cycle could bring about another top in the first week of August, unless it is overridden by the 22-wk and the 36-wk cycles which are scheduled at the same time and which could turn that time frame into a low.

Breadth

The NYMO and NYSI (courtesy of StockCharts.com) are shown below. After a short consolidation, the NYMO made a new high along with the SPX on Friday. There is no divergence, but it is a fifth wave from the low, and this could cause it to retrace.

The continued strength in the above indicator has helped the NYSI to continue rising and it is now challenging its down-trend line. The RSI has reached the 50% line and may need to consolidate for a while before moving higher, in the same way that it did in September 2011.


Sentiment Indicators
- The VIX


This is a 60-m chart of the SPX (top) vs. VIX (bottom). I have marked where the divergence between the two indices resulted in a trend change. The red vertical lines indicate a top in the SPX and the green line, a low. We are at a point when divergence between the two indices suggests that a top may be forming in the SPX. If you add this warning to the reaching of the 1343 target, and the non-confirmation by the other indices mentioned earlier, you have what constitutes a potential red flag at this juncture.


XLF (Financial SPDR)

Normally, this is an index which also shows divergence with the SPX when the latter is close to a reversal. It’s a moot point whether divergence can be seen to exist at the place which is marked by a red asterisk. By Friday’s close, the only high which remained standing was the top of the first phase from the 6/04 low. By itself, it would probably not mean much, but reinforced by what VIX and TLT are showing, it could be meaningful. Let’s wait until Monday to see if it has negative implications for the way the market opens.


BONDS

TLT has the same potential H&S pattern which is found in a reverse manner in the other indices. But it also showed a lack of conformity with SPX on Thursday and Friday. While the former was going up in the past two days, TLT should have been going down and, clearly, it did not. Can so many signals developing in various indicators be false? We’ll see on Monday!


UUP (Dollar ETF) Daily Chart

By contrast, and by its concerted decline, UUP is fully confirming the rise in the equity markets – well, some, anyway! So, is this index throwing a wrench into the works of those which are giving us a different picture? Perhaps not! If you look at the indicator, you will see that it has formed some positive divergence to the price over the past two days, and that it is threatening to break its downtrend line. That may be enough to put UUP on the same wave length as the others which are looking for a reversal in SPX.


GLD (ETF for gold)

GLD has been in an intermediate consolidation pattern ever since it reached its 185 (interim?) long-term projection in early September, 2011. It has now made a double-bottom at the 149 level, and started a short-term uptrend which, according to the Point & Figure chart, could take it to 162. It has already broken out of a short-term channel, but is still a long way from doing the same with its intermediate channel. At this time, it would have to go to at least 164 to challenge the top channel line.

Whether it can do that or not will depend, in part, on whether or not the 25-26 week cycle has already made its low. If it has, it would put it in the same predicament as the 2-year cycle which may have made an early low. In the past, after the gold cycle has bottomed, the price starts to move up decisively, making it clear that a low had occurred. The last two lows are a good example of this action. So far, the current pattern does not have that characteristic and leaves us in doubt as to whether or not the low has been made.

The indicator has come from an oversold position and spiked into positive territory. Now, however, it looks as if negative divergence is forming and it is questionable if GLD can overcome the overhead resistance which has just capped its initial rally. More time is needed to determine if the index is in a position to resume its long-term uptrend. In the meantime, should it break the 149 support, it could quickly fill its long-standing projection target of 141.


OIL (USO)

In the last newsletter, I had a long discussion about USO’s future prospects, which don’t seem to be very bright:

“From its high of 119 in June of 2008, the stock dropped straight down to 23 in February 2009 and has gone essentially sideways since. The highest retracement it has been able to achieve was when it rallied to 45 in April of last year. That represented a rebound of exactly 23.6% of its total drop.

USO is very likely to break its 23 low and eventually end up somewhere around 8. But this projection, if correct, will only be reached in the Fall of 2014 when the next bear market comes to an end.”

For now, USO has reached a short-term projection and is beginning to consolidate. The sharp decline that it has just completed has all the appearances of being a wave 3 from the 42.30 high. If so, it would mean that it is now starting wave 4 and, therefore, expected to rally for a while. When 4 is complete, wave 5 would probably take it down to its long-term support of 29.10. However, as stated above, it is not likely that this would be the end of the decline. It looks to me as if USO has much more ground to cover on the downside over the next couple of years.


Summary

This was stated in the last Summary: “The SPX may be ready to extend its near-term correction before moving higher and completing its rally from 1267. The top is expected to be around 1343 and come in mid-June. After that, an additional decline should take hold which could lead to a marginal new low.”

What was written in the first two sentences has come to pass, but the next prediction may not be realized literally. First, it is very possible that the rally will be extended to 1353 before it peters out. Next, it does not seem likely that any pull-back will cause the SPX to make a new low.

As I have written above, there are many signs that the enthusiasm displayed by the DJIA and the SPX is not shared by other important segments of the market. And, since the result of the Greek elections will have an immediate effect on whether the rally is extended to the higher projection, or if we begin to pull back immediately, I will wait until tomorrow to extend my forecast.

Andre

FREE TRIAL

HOW GOOD ARE YOU?
I challenge you to sign up for an introductory, four-week subscription now, and compare your market forecasts to mine! I will e-mail on-going, intra-day market updates with comments and explanations, plus summaries of the daily action and a weekly report. My service is ideally suited for traders, but it is also valuable to longer-term holders since price projections will be provided to you through Point & Figure analysis (which pin-points the probable extent of market moves) along with best-time estimates obtained from cycle analysis.

ARE YOU AS SUCCESSFUL AS YOU COULD BE? Fear or your ego may be getting in the way. Verify your own research! You may happily discover that there is a service which is uncommonly dependable and also reasonably priced…called Market Turning Points.
For a FREE 4-week trial, Send an email to: ajg@cybertrails.com
For further subscription options, payment plans, and for important general information, I encourage you to visit my website at www.marketurningpoints.com. It contains summaries of my background, my investment and trading strategies, and my unique method of intra-day communication with subscribers. I have also started an archive of former newsletters so that you can not only evaluate past performance, but also be aware of the increasing accuracy of forecasts.

The above comments about the financial markets are based purely on what I consider to be sound technical analysis principles. They represent my own opinion and are not meant to be construed as trading or investment advice, but are offered as an analytical point of view which might be of interest to those who follow stock market cycles and technical analysis.

Sunday, June 10, 2012

See what's unseen in these financial markets: Andre Gratian's 6/10/12 Turning Points report

Technical analyses reveal what's going on under the surface of the markets, so be sure to read Andre Gratian's report below, because you may be surprised by his Turning Points update, covering the S&P 500, volatility index (VIX), the XLF (the financials ETF), bonds (TLT), the US dollar, gold and oil (thanks again, Andre!). You can get more info about Andre's work at his website (including his intraday update subscriber series), at http://www.marketurningpoints.com/. And now, Andre's update (click any of his charts to see it as a larger image):

=============

June 10, 2012

Market Turning Points
Week-end Report

By Andre Gratian

MORE WORK BEFORE INTERMEDIATE LOW?
Precision timing for all time frames through a 3-dimensional approach to technical analysis: Cycles - Breadth - P&F and Fibonacci price projections, and occasional Elliott Wave analysis
“By the Law of Periodical Repetition, everything which has happened once must happen again, and again, and again -- and not capriciously, but at regular periods, and each thing in its own period, not another’s, and each obeying its own law … The same Nature which delights in periodical repetition in the sky is the Nature which orders the affairs of the earth. Let us not underrate the value of that hint." -- Mark Twain
Current position of the market

SPX: Very Long-term trend – The very-long-term cycles are down and, if they make their lows when expected (after this bull market is over) there will be another steep and prolonged decline into late 2014. It is probable, however, that the steep correction of 2007-2009 will have curtailed the full downward pressure potential of the 120-yr cycle.

SPX: Intermediate trend – SPX is working on an intermediate low.

Analysis of the short-term trend is done on a daily basis with the help of hourly charts. It is an important adjunct to the analysis of daily and weekly charts which discusses the course of longer market trends.

Daily market analysis of the short term trend is reserved for subscribers. If you would like to sign up for a FREE 4-week trial period of daily comments, please let me know at ajg@cybertrails.com.

Market Overview

As anticipated in last week’s newsletter, which was entitled “MARKET LOW FORMING”, the indices did find a low on 6/04 and have been rising since. So far, the SPX has tacked on a quick 62 points, but may find the going a little tougher from this point on. Although Friday’s session was positive, the action looked tentative, cautious, as if the main players were sitting on the side lines ahead of the week-end. That could mean that they are expecting some news which may affect the market adversely. However, unless we see some significant weakness develop, this could turn out to be part of the consolidation which started on 6/09 and, when it’s over, we could go on to reach our intended target for this rally.

There are three potential projections. The most conservative is 1333. The next, which is moderate, is 1343. And there is an optimistic target of 1353. Since all of them exceed the high of 1329 which has already been reached, the odds favor a move past that level with the SPX deciding which target it wants to honor.

It is also possible that 1329 was “it” for now! At best, the SPX has only made a short-term low and it will have to do more work to turn it into an intermediate uptrend. This could entail expanding the current base, either by re-testing the former low of 1267, or even going beyond. Remember that there are still some unfilled projections from the top distribution pattern which call for potential lower targets -- perhaps as low as 1233. And since the daily indicators have not yet given a credible buy signal, the danger of exceeding the former low still exists. The near-term fate of the market should make itself known as early as at the opening, on Monday.

Chart analysis

As we do the majority of the time, we’ll start with the Daily Chart of the SPX. It’s easy to read and it gives us a good perspective on the market position. After correcting for a couple of months, the SPX found combined support from the lower channel line of the larger (blue) channel, the green line drawn across previous tops, and the bottom line of its short-term corrective (red) channel. That, in connection with the bottoming of several cycles pretty much ensured a rally.

However, there are remaining conditions which this rally will have to fulfill to continue. First, the SPX will have to overcome its previous high of 1335 and, although it has breached the decline’s short-term down-trend line, it will have to get out of the red channel before we can declare that a reversal has taken place. And there is something more subtle which suggests that this is more of an oversold bounce than a bona fide reversal. There is no visible deceleration in the decline! On its last down leg, the index went all the way to the bottom of the channel. My guess is that we will have to re-test that low and perhaps even go lower until some deceleration appears by its staying away from the lower line of the red channel. Until we see that, the odds that the market has made a low are questionable.


This analysis of the price action is borne out by the indicators. There was some divergence, which meant that a bounce was coming (we knew that cycles were bottoming in this time frame), but the oscillator has not yet been able to go through the longer trend line as well as becoming positive. It stopped fractionally above the zero line. The fact that it went past the former top is a positive, and the odds favor an extension of the rally whether or not there is a pull-back – unless the pull-back is so severe that it significantly alters the near-term price action. This is why next week is so important!

The Hourly Chart allows us to focus on the important aspects of the chart. Here, we can see that, at the low, the price actually went beyond both channels -- an indication of an oversold condition which is ripe for a rebound. Also, the indicator was showing some positive divergence (green arrow) at the same time that it was making a bullish cross of its MA.

Now, however, we have almost the same condition, but in reverse. The opening on Monday morning will make a lot of difference as to what comes next. If the market has a strong opening, it will erase the negative divergence in the indicator by moving through the 200-hr MA and probably the former short-term top of 1335 as well, and proceed to one of the projection targets indicated earlier.

If, on the other hand, there is a weak opening, then the index could re-test 1307, or even move lower before resuming the rally. Going below 1296 would be a negative, indicating that the bounce is most likely over, and that we are dropping into the cycles in the middle of the month (This is not the favored scenario).


Cycles

The cluster of cycles that we discussed last week as a potential time slot for a near-term low worked out well. And now? Have the cycles already exhausted their potential in light of what lies ahead? Perhaps not right away. There are some cycles slated for the middle of June which could turn out to be a market high, rather than a low. The real challenge for the market will probably come in early July if what I call the 2-yr cycle continues to repeat its historical pattern. If it does, this would be the best time for the SPX to secure an intermediate low.

Breadth

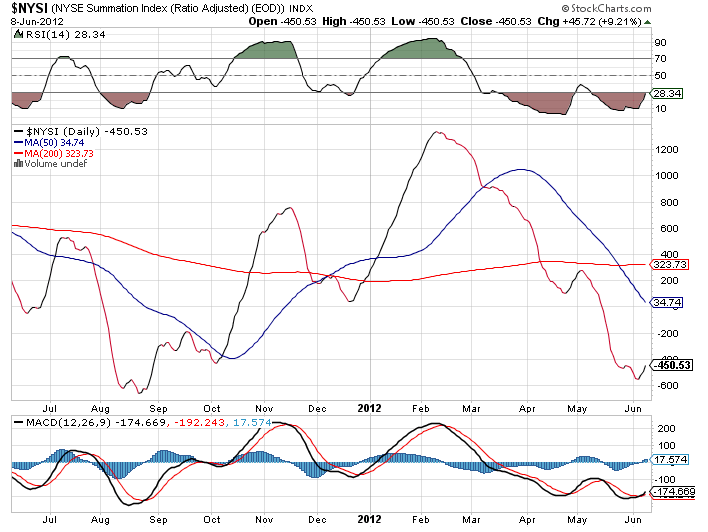
Steady improvement in market breadth has kept the NYMO above zero, and this has caused the NYSI to reverse its downtrend. The new pattern is still fragile and will most likely be tested over the next two to three weeks, when the 2-yr cycle bottoms. This test could result in producing the classic formation made by the NYSI at an intermediate market low: positive divergence, followed by a resumption of its uptrend.


Sentiment Indicators

The SentimenTrader (courtesy of same) long-term indicator is pretty much in the same place as it was last week. Perhaps a little less bullish. The one on which to focus right now is the short-term index, because it has moved a lot closer to giving a sell signal.


The VIX

VIX adds to the perception that we are about to get another near-term pull-back in the market. It developed some positive divergence to the SPX during the last few hours of trading on Friday. The indicator tends to confirm this.

Note, however, that the index has only broken a short-term trend line and is still in an uptrend until it moves below its former near-term low. If this does not happen shortly, it will reinforce our notion that we have not yet made an intermediate bottom.


XLF (Financial SPDR)

The XLF has risen all the way to the top of the former short-term high, which makes it slightly stronger than the SPX. However, the indicator is showing some negative divergence which tells us that, unless there is some strong upside momentum at Monday’s opening, it is likely to continue to consolidate along with the market.

Like the SPX, it did not show any deceleration at the last low, which means that it will probably retest its low or make a slightly lower low before a better reversal occurs.


BONDS

After making a new high, TLT stopped its climb in a “blow-off” move similar to what it did when it reached its 125 projection, finding resistance at the junction of two internal trend line parallels with divergence showing on the lower indicator. All this at a time when the SPX met one of its projection levels in a semi-climactic manner, and reversed.

It is now likely that TLT will make an intermediate top at its 133-134 Point & Figure target at the same time that an intermediate bottom is being established by the SPX and other equity indices. Just as the SPX will not have a significant reversal until it breaks out of its descending correction channel, TLT will not enter into an important correction until it breaks below the rising 21-DMA and the trend line which define its uptrend. For now, its first pull-back found support at the recently penetrated 125 top.


UUP (Dollar ETF) Daily Chart

It’s easy to see that UUP is in an intermediate uptrend which could be morphing into a long-term trend. After all, the index should be on its way to about 25 while the US dollar reaches its 90 base count, but don’t expect this to happen over the next couple of weeks.


UUP has just met – and even exceeded – a short term projection to 22.80, which denotes that there is probably enough upside momentum to take it to its next short-term projection of 23.30 -- “coincidentally” at the top of the present channel. This could come when the SPX tries to find an intermediate low around early July.

GLD (ETF for gold)

GLD may be in the process of completing an intermediate correction that has been in process for ten months. Its next low is expected to be in mid-June in conjunction with the 25-wk low. If it holds the 149 level, it will have built a base which may allow it to challenge the top of its declining channel. This could be the resumption of its long-term uptrend, but it will not be confirmed until it has risen above 174 -- the top of the February high.

A break-out into a new long-term uptrend does not appear to be right around the corner. The index will first have to build a P&F base large enough to reach its long-term projection of 233. There is still more work to do!


OIL (USO)

USO has been in a steep correction that has shaved off 25% of its value over the past three months with most of it occurring in the last month. But this should be coming to an end. The index had a projection of 30.50/31.00 and, with a low of 31.03 about a week ago, it should now begin to build either a base or a re-distribution phase which could take some time to complete.

The current count comes only from the distribution phase at the right of the top. If we extend the count across the entire area above the green line, we arrive at a projection which is 10 points lower. That would clip off another 25 percent from the top for a total of 50 percent. But this does not sound extreme considering that there is nothing bullish about the long-term chart. From its high of 119 in June of 2008, the stock dropped straight down to 23 in February 2009 and has gone essentially sideways since. The highest retracement it has been able to achieve was when it rallied to 45 in April of last year. That represented a rebound of exactly 23.6% of its total drop.

USO is very likely to break its 23 low and eventually end up somewhere around 8. But this projection, if correct, will only be reached in the Fall of 2014 when the next bear market comes to an end.


Summary

The SPX may be ready to extend its near-term correction before moving higher and completing its rally from 1267. The top is expected to be around 1343 and come in mid-June. After that, an additional decline should take hold which could lead to a marginal new low.

It is possible that 1329 will turn out to be the top of the rally, but it’s not the preferred scenario. Whether the index extends is correction or moves higher right away will be decided first thing Monday morning.

Andre

FREE TRIAL

HOW GOOD ARE YOU?
I challenge you to sign up for an introductory, four-week subscription now, and compare your market forecasts to mine! I will e-mail on-going, intra-day market updates with comments and explanations, plus summaries of the daily action and a weekly report. My service is ideally suited for traders, but it is also valuable to longer-term holders since price projections will be provided to you through Point & Figure analysis (which pin-points the probable extent of market moves) along with best-time estimates obtained from cycle analysis.

ARE YOU AS SUCCESSFUL AS YOU COULD BE? Fear or your ego may be getting in the way. Verify your own research! You may happily discover that there is a service which is uncommonly dependable and also reasonably priced…called Market Turning Points.
For a FREE 4-week trial, Send an email to: ajg@cybertrails.com
For further subscription options, payment plans, and for important general information, I encourage you to visit my website at www.marketurningpoints.com. It contains summaries of my background, my investment and trading strategies, and my unique method of intra-day communication with subscribers. I have also started an archive of former newsletters so that you can not only evaluate past performance, but also be aware of the increasing accuracy of forecasts.
The above comments about the financial markets are based purely on what I consider to be sound technical analysis principles. They represent my own opinion and are not meant to be construed as trading or investment advice, but are offered as an analytical point of view which might be of interest to those who follow stock market cycles and technical analysis.