There appear to be various indications that we could have a small pullback before the stock market moves higher. Such a pullback might last for only one day, so be aware of that. The FOMC is coming up next week, and normally we would also expect the new months, new money effect to produce higher prices in the later part of the week, August 1-3. At this point, be prepared for the possibility of a dip on Monday, and then be alert for whether Thursday, August 2 will be a high or low. A pullback may only retest SPX 1350's to 1360. Be sure to read Tony Caldaro's Objective Elliott Wave weekend update at http://caldaro.wordpress.com/2012/07/28/weekend-update-355/. He mentions the importance of SPX 1344 in case there's an overbought pullback. He also addresses bonds, currencies, commodities, and other countries' indices.
A potential wildcard in all this is that today, July 28, is a Bradley turn date. I'm told that the Bradley turn dates have been having better accuracy this year. Normally, I don't put much stock in them, and even today we cannot be certain whether this is producing a high right now, or will it simply give us a pullback before a further move up. Just something to keep in mind with all else.
One concerning note is that the McClellan Oscillator didn't make a higher high than it did early July, which looks like a non- confirmation so far. It's early yet, so just another reason to consider a pullback. It'll become more concerning if the indices advance higher without higher highs in the oscillator. It's the one chart I wanted to include with this post (other charts I already posted last night via Twitter) but having technical difficulty click on the Twitter pic link to see it: . The Summation Index is also rolling over, which supports the concerns that the longer term might not be so good either. There's a similar point about the VIX, it made a higher low (not a lower low) so that's a bearish divergence. Also there's a short- term trading signal on VIX that bought Thursday and closes out Monday. Again just something to consider for the weeks ahead. It's also noteworthy that the Dow Industrials $DJI $INDU are stronger, while the Nasdaq 100 $NDX and Russell 2000 $RUT are weaker.
Assuming we pullback a day or so, before we move higher, how high? There seem to be various reasons to expect the SPX to rise above 1400 again.** After that, it's a matter of whether this really is a bull market that will carry on to new higher highs, or at least rise above 1500 again. Or, will the market roll over again and retest the June 4 lows about 1260's to 1280, or go even lower. Personally, I think it can go either way. That's why I think it is increasingly important to be flexible, and to pay attention to timing since the timing of a low or high - rather than absolute price - can be the way to decide whether to hold or fold, and when to re-enter.
**NOTE - I just watched and do recommend Chris Ciovacco's charts analysis video at http://ciovaccocapital.com/wordpress/index.php/stock-market-us/bulls-still-in-control/ covering the SPX, equities in general such as other countries and financials, the VIX, internals and breadth, and DeMark indicators status & projections. I'm impressed by the quality and clarity of his analysis; so I highly recommend watching it. Doesn't change my thinking but he does a great job of showing why this market is more bullish than many realize - if support holds!
One cycles source that is proving to be very interesting is the "Change in Trend" blog, and you should take a look at the new post there, at http://changeintrend.wordpress.com/2012/07/28/the-drop-zone/. Their information suggests that August 9 may be a high, and I am also seeing from various cycle methods that August 6-9, and especially August 8 or 9, may be a very significant high.
The week that includes August 8 and 9 is also an important week in terms of the Tom Demark indicators, I've been told. I'm no expert in that method, although I have begun to study up. It is my understanding that, since that will be week 9 after the June 4 low, and so long as the Demark support levels are not violated (seems no problem now), the market will be set up for a "Wave C" down to retest the June 4 lows. So that's something to consider too!
This is all in context of the bigger cycles. It's important to understand that the four-year cycle may or may not have topped out. If it has, then the idea of retesting and moving under the June 4 lows becomes quite serious. Otherwise, if the four-year cycle has not topped out, then we could see higher prices around October to November 2012, and even during the year 2013. I've seen good analyses that would project an important peak either in the spring, or in Jun, or August 2013.
One more note: Terry Laundry passed away earlier this month. His remarkable T Theory - which many appreciated, and others don't agree - often pointed to important tops. He used to provide audio commentary about this at TTheory.com. His last commentary July 7, 2012 described a mega-T that topped mid-2011 and another (40-year vintage) that topped March 2012. He seemed to think that was it, and the market shouldn't produce any new higher highs for a few years. The work will be left to Parker Binion who's carrying forward Terry's work to help determine if there might be any more ancient T's that might produce higher highs, or was the early 2012 peak all that we get before the bear market sets in.
May as well note also that Martin Armstrong has written a new post at his blog, at http://armstrongeconomics.com/2012/07/28/dow-jones-rally/. He doesn't get very specific for free, but mentions both the ideas of a high August or September, along with a possible panic but not clear if that might be during August or more in September, even October.
These are ideas to ponder until we get past mid-August. For now, it's a matter of navigating the next two weeks.
Showing posts with label Cycles on Bradley model. Show all posts
Showing posts with label Cycles on Bradley model. Show all posts
Saturday, July 28, 2012


Wednesday, January 25, 2012
Stocks and corporate bonds flirt with Fibonacci, geomagnetics and time cycles
Some combination of bullish Apple (AAPL) and the Fed (FOMC today) push stock indices higher again. Starting during the noon hour, stocks anticipated by rising and then strengthened yet more after the Fed announcement. Interestingly the SPX went right to 1327, a level that was suggested by Fibonacci analysis I described back in November. If it tries higher, there's another even more interesting level - 1332, which is two times the 666 which SPX touched back in March 2009. The exact level was about 666.79 so twice that is somewhere around 1333 to 1334. But there's a Bradley turn date coming up on January 28 - normally a time I'd expect a low, because it's around the "fund manager special" end-month time that usually gives us a lift into the new-month new money that we'd expect the first several days of February. It isn't a major Bradley date, but there are cycles reasons to brace for a reversal to occur anytime soon.
One of those is suggested by geomagnetics work done by John Hampson, as shown in his MT Stock Market Model showing a full 2012 year forecast. This work in his MT Model is based on geomagnetism plus Bradley turn dates and new/full moons, and you can study it at his website at: http://amalgamator.co.uk/MTStockMarketModel.aspx.
Another is Fibonacci - one of the Fibonnaci time cycles work I've done is to take the 17-month decline from October 2007 to March 2009 (interesting in itself as two times 8.6 months, where 8.6 may be a basic time interval), and project highs at the 1.382, 1.618 and 1.786 projections - all of which did occur during 2011. This month, January 2012, is the 2.0 time extension, which I originally thought could also produce a high. Later I'd become concerned that it could be a low, based upon a certain view about cycle lows from Terry Laundry's T Theory, but that clearly didn't happen. Instead, the cycle high projected by Jim Curry for this time period seems to be converging with this Fibonacci time extension.
The idea of this month being the 2.0 time extension also means it's possible to see a high-low-high/low-high cycle playing out, based on the 17-month time periods. If the 17-month period retains predictive strength going forward, then it may point to a significant low (or high, but I'm guessing low) in June 2013.
One of those is suggested by geomagnetics work done by John Hampson, as shown in his MT Stock Market Model showing a full 2012 year forecast. This work in his MT Model is based on geomagnetism plus Bradley turn dates and new/full moons, and you can study it at his website at: http://amalgamator.co.uk/MTStockMarketModel.aspx.
Another is Fibonacci - one of the Fibonnaci time cycles work I've done is to take the 17-month decline from October 2007 to March 2009 (interesting in itself as two times 8.6 months, where 8.6 may be a basic time interval), and project highs at the 1.382, 1.618 and 1.786 projections - all of which did occur during 2011. This month, January 2012, is the 2.0 time extension, which I originally thought could also produce a high. Later I'd become concerned that it could be a low, based upon a certain view about cycle lows from Terry Laundry's T Theory, but that clearly didn't happen. Instead, the cycle high projected by Jim Curry for this time period seems to be converging with this Fibonacci time extension.
The idea of this month being the 2.0 time extension also means it's possible to see a high-low-high/low-high cycle playing out, based on the 17-month time periods. If the 17-month period retains predictive strength going forward, then it may point to a significant low (or high, but I'm guessing low) in June 2013.


The big question of course is whether stocks are topping out for a big move down, or just positioning for a pullback before another thrust upward. Honestly I can see it either way. The bullish percent for Nasdaq is getting overbought with a little negative divergence, and there's negative divergence in the McClellan Oscillator (for NYMEX and SPX) too. The Nasdaq is leading both SPX and the Dow Industrials by having exceeded its 2011 highs, but that might also be negative divergence among the indices. Near-term, I think we just need to see if the SPX makes it past 1327 (bullish if 1327 becomes support), or goes under 1307 (bearish).
At least, it look prudent to keep on watch for a potential reversal, which is what I recommend that KI$$ investors and swing traders do here.
If you're looking for a turn in something, check out high-quality corporate bonds. You can see below that corporate bonds have also continued to perform very well. Both LQD, representing high-quality bonds, and HYG representing high-yield corporate bonds, have continued bounding upward. LQD has now already exceeded its P&F projection, and HYG now has a new higher P&F target (114) based on its breakout. There is some negative divergence, however. Look especially at the LQD monthly chart - the StockRSI indicator is retesting up to its midline. When this occurs as price is tagging new highs, it is a warning and possibly a preliminary sell signal. It would be prudent to give it another day or two and look for price to close in the lower third of a daily range and below the low of the prior day that tags a high.
As part of this view, I'd like to note that LQD rose above the 109 price that was a Fibonacci extension, and then tested it as support before resuming the current rise. If LQD moves back under 109 on the next drop, it will be an important signal that it will have lower levels to test.


Monday, January 16, 2012
Price, time & technicals herald big moves coming in stocks, gold & bonds: Andre Gratian's 1/16/12 Turning Points update
I know many traders have been looking for a stock market drop or pullback (maybe even based on Bradley or other cycle turn dates). Well, it may be arriving - and what about gold, plus U.S. bonds and the dollar? Here's the scoop from Andre Gratian in his latest Market Turning Points update (thanks again, Andre!). You can get more info about Andre's work at his website (including his intraday update subscriber series), at http://www.marketurningpoints.com/. And now, Andre's update (click any of his charts to see it as a larger image):
SPX: Very Long-term trend – The very-long-term cycles are down and, if they make their lows when expected, there will be another steep and prolonged decline into 2014.
SPX: Intermediate trend – Intermediate uptrend still intact, but short-term top… or more, is now very close.
Analysis of the short-term trend is done on a daily basis with the help of hourly charts. It is an important adjunct to the analysis of daily and weekly charts which discusses the course of longer market trends.
Daily market analysis of the short term trend is reserved for subscribers. If you would like to sign up for a FREE 4-week trial period of daily comments, please let me know at ajg@cybertrails.com.
Market Overview
Deceleration in the SPX is becoming more and more obvious on the Point & Figure chart and in the hourly chart. This, in concert with overbought daily indicators, is a clear warning that we are approaching the end of the trend which started at 1159 on 11/25, and perhaps of that going back to 1075 in early October, as well. Last week, the SPX made a triple-top on its hourly chart (only a double-top on the daily chart), after barely overcoming the 1292 high of Dec. 27. Is this it? Or is there more to come?
Since, as of Friday, there was no clear sell signal, it is possible that we could go a little higher or, at least, continue to work a little longer at expanding the top formation. On the P&F chart, the index has already formed a pattern which looks very much like distribution, with trading confined to a 20-30-point range. If prices fail to break out of this range on the upside or, if there is a break-out of a few points with an immediate retracement into the range, it will be a sign that buyers are exhausted and that sellers are getting the upper hand.
Should this happen, we could identify everything above 1266 as a possible top formation which already measures nearly 100 points across (P&F). That means that if that level is broken, we are looking at a potential 100-pt decline in the SPX. That would not be enough to put an end to the intermediate trend which started at 1075 unless, after a re-distribution level is formed, it becomes a possibility if the decline continues beyond 1159.
Let’s not speculate, but take it one step at a time and concern ourselves first with the topping formation, and then with the ensuing decline. We’ll start by analyzing the developing top formation on the Daily SPX Chart.
Chart analysis
Don’t expect to see a potential 100-point top on this chart. It’s the business of the P&F chart to show that. What we do see here, is a larger trend which started at the beginning of October (3-yr cycle low) from 1303, which is delineated by the purple channel lines, and which, as of last Thursday, was still making new highs.
Within that larger uptrend, there are several smaller ones, beginning with a spectacular four-week rally from 1203 to 1292 whose high was only bested last week – barely! Since then, the trend has been essentially sideways having, at best, a vague resemblance to an inversed Head & Shoulders pattern. If it is, we should only get a minor pull-back to the neckline (not shown) and then resume the uptrend. The SPX could also be making a broad consolidation pattern before moving higher.
For now, the last short-term uptrend from 1203 appears to be coming to an end. If we turn to the indicators, we can see that the MSO has now been overbought for about two weeks, and that the MACD and the A/D are both showing negative divergence. More importantly, there has been a long-standing P&F projection of 1293-94 created by the base that formed above the 1203 level. This count was filled last week when the SPX moved to 1296. It tried to move beyond that level two more times in the course of the week, but could not and finally fell back on Friday.
Because the SPX has not yet given a sell signal, and because it formed a small re-accumulation level at 1277 (which gives it a potential move to 1299), it is still possible that the index could move a little higher next week. As we will see next, the Hourly Chart indicators are also suggesting that this is possible.
What a beautiful short-term uptrend this is! From 1203, the SPX has moved up in a steady progression of higher highs and higher lows, within a well-defined channel which has yet to be violated. And yet, one could tell, almost from the start, that the extent of the move would be limited. Look at the MACD: from the very first top it started to show negative divergence, and this has become more and more pronounced as the trend moved higher. You can also see how price failed to get to the top of the channel a couple of weeks ago and was followed by a move sideways. For the first tie, on Friday, the SPX broke below the median and almost reached the bottom of the channel.
This loss of momentum is a negative but, according to the P&F, there is still a potential for going a little higher. And look at the indicators! They are oversold and trying to reverse. That puts the odds slightly in favor of re-testing last week’s high, and perhaps even going a little higher.
Cycles
Next week is approximately six months from the July 2011 peaks and could bring about a high.
If we do have a reversal over the next few days, the downtrend could last until the first week in March when the next 15-wk cycle makes its low, along with two other important short-term cycles.
Breadth
As expected, the Summation Index (courtesy StockCharts.com) has continued to move up until its RSI reached the overbought condition. Since both have not yet turned down, it’s another reason to expect a little more from the SPX, either in time or price before it rolls over.
In spite of its current upside momentum, the NYSI is unlikely to make a new high, or even match its previous high. This would create negative divergence to the price, and could be a sign that the SPX is ready for a significant decline.
Sentiment
This is the lowest level that we have seen on the SentimenTrader (courtesy of same) long-term index since the SPX July top, which confirms expectations that we have arrived at an important market top.
For the past few weeks, we have been looking at the weekly chart of the VIX. This week, we’ll look at the Daily Chart instead, because positive divergence has appeared in the price as well as in the indicators -- something that we have not seen for a long time in the VIX -- and you know what that means: it’s reversal time for the SPX! Even by itself, it would be a powerful enough signal, but combined with everything else that we have discussed so far, if you are a bull, you should start feeling a tad uncomfortable.
The positive divergence only shows up in the daily chart, not in the weekly chart. If our past study of the VIX behavior is valid, this should denote a short-term or intermediate-term reversal, not a major top. Besides, the VIX P&F chart is only forecasting a move to about 28 after which it should go through another phase of consolidation. The last important uptrend in the VIX started after a long basing period and went to 48. The current condition does not show any similarity and we should not be looking for a major decline in the SPX; nothing like the downtrend from 1370 to 1075. We will have a better idea of what to expect when the top pattern of the SPX is complete and we can make a P&F projection.
BONDS
The week before last, TLT broke an important trend line, seemingly forecasting a trend reversal that could take it down to 110. But that was a devious maneuver meant to hide its true intentions which are to extend its uptrend, possibly to a new high.
Here is the TLT Daily Chart. Two price channels have been drawn: the more narrow one, which encompasses the uptrend from last February, and the wider one, which has its starting point in April 2010. While the long-term uptrend appears secure, the intermediate trend fooled us into thinking that it might be coming to an end two weeks ago when the index started to trade outside of its lower channel line. But there was no follow-through, and the similarity between the action of TLT and VIX over the past two weeks is suggesting a possible resumption of its uptrend.
This could result in a new high for TLT. What looked like distribution on the P&F chart now looks like re-accumulation instead with a potential for taking the price to 126-127.
The indicators have not yet given a conclusive buy signal, but they have started to reverse from an oversold position. This is a warning that the consolidation is probably over and that another uptrend is about to start. We’ll give it a little more time to make sure!
UUP (Dollar ETF)
This week, we’ll go back to analyzing the weekly chart of UUP where there is no equivocation about the direction of the trend. It’s up! The price has just gone beyond a strong resistance area and made a new high. It has moved within an up channel since mid-August, and is getting ready to challenge its 200-wk MA. The indicators are also in a strong uptrend, even though the MSO is overbought. The MACD is particularly impressive, having just broken above a long-term trend line and continuing to move higher with no sign of deceleration.
The action of UUP appears to confirm what the US dollar P&F chart has been telling us. Between May and August 2011, the index created a base which is projecting a move to 90 (on Friday, the dollar closed at 81.51). There is an interim phase count to 83 which could result in a pause in its uptrend and give the SPX a chance to consolidate.
The dollar/UUP ratio remains fairly constant at about 3.58. When the dollar moves to 83, UUP should be at about 23.20, and at 90, UUP would be at about 25.10, slightly outside of its long-term channel.
GLD (ETF for gold)
The long-term trend in the SPX and in gold are not exact replicas, but they are more similar than not. If there is a noteworthy correction in the SPX, it could affect gold negatively. This confirms what we see when we analyze gold based on its own technical merits.
Analyzing GLD is the same as analyzing gold. GLD is currently in an intermediate downtrend which is incomplete. Although it has recently bounced from 148.27 to 161.62, it is still within the confines of its down-channel. As you can see on the chart, it found support on its long-term trend line from 2008, as well as from a former congestion level created between May and July 2011.
After it made its high of 185.85, the P&F chart created a projection down to a minimum of 143-144 with a maximum of 134. The re-distribution level that formed around 170 confirmed these initial projections. GLD did not initially make it down to its P&F projections because of the support levels mentioned above. But it is very likely that there will be another attempt at meeting these targets before the index is ready to resume its long-term uptrend.
It is unlikely that gold has reached it final high. From the re-accumulation level which occurred between March 2008 and August 2009, we could derive two distinct projections: a minimum move to about 187-189 (the high came near 186), and a maximum move to 233. Therefore, when the intermediate correction is over, GLD should be able to proceed to the higher projection.
Before it is ready to do that, the following should take place:
1 – GLD should, at least, meet its downside target of 143, and perhaps of 134 as well.
2 -- When an intermediate correction occurs, the initial uptrend usually resets to a lesser angle of ascent. By holding on to the long-term trend line, this did not take place. However, moving down to 143-134 would do the trick.
3 – On the P&F chart, the correction should create a re-accumulation base which is substantial enough to give a confirming count to the next higher projection of 233. This has not been done, and could take a while.
For these reasons, the odds are that GLD needs more work in time and price before its correction is complete.
Summary
There is a virtual fanfare of warning signs heralding the arrival of a (perhaps significant) top for the SPX and other equity indices. How significant is a question that we will have to let the market answer in due time.
When the top is complete (perhaps by the end of next week) the P&F chart should give us an estimate of the decline’s extent.
Andre
FREE TRIAL SUBSCRIPTON
If precision in market timing for all time frames is something that you find important, you should consider taking a trial subscription to my service. It is free, and you will have four weeks to evaluate its worth. It embodies many years of research with the eventual goal of understanding as perfectly as possible how the market functions. I believe that I have achieved this goal.
I can’t resist sharing these two subscriber emails that I received recently:
For further subscription options, payment plans, and for important general information, I encourage you to visit my website at www.marketurningpoints.com. It contains summaries of my background, my investment and trading strategies, and my unique method of intra-day communication with subscribers. I have also started an archive of former newsletters so that you can not only evaluate past performance, but also be aware of the increasing accuracy of forecasts.
The above comments about the financial markets are based purely on what I consider to be sound technical analysis principles. They represent my own opinion and are not meant to be construed as trading or investment advice, but are offered as an analytical point of view which might be of interest to those who follow stock market cycles and technical analysis.
=============
January 16, 2012
Market Turning Points
Week-end Report
By Andre Gratian
Precision timing for all time frames through a 3-dimensional approach to technical analysis: Cycles - Breadth - P&F and Fibonacci price projections, and occasional Elliott Wave analysis
“By the Law of Periodical Repetition, everything which has happened once must happen again, and again, and again -- and not capriciously, but at regular periods, and each thing in its own period, not another’s, and each obeying its own law … The same Nature which delights in periodical repetition in the sky is the Nature which orders the affairs of the earth. Let us not underrate the value of that hint." -- Mark TwainCurrent position of the market
SPX: Very Long-term trend – The very-long-term cycles are down and, if they make their lows when expected, there will be another steep and prolonged decline into 2014.
SPX: Intermediate trend – Intermediate uptrend still intact, but short-term top… or more, is now very close.
Analysis of the short-term trend is done on a daily basis with the help of hourly charts. It is an important adjunct to the analysis of daily and weekly charts which discusses the course of longer market trends.
Daily market analysis of the short term trend is reserved for subscribers. If you would like to sign up for a FREE 4-week trial period of daily comments, please let me know at ajg@cybertrails.com.
Market Overview
Deceleration in the SPX is becoming more and more obvious on the Point & Figure chart and in the hourly chart. This, in concert with overbought daily indicators, is a clear warning that we are approaching the end of the trend which started at 1159 on 11/25, and perhaps of that going back to 1075 in early October, as well. Last week, the SPX made a triple-top on its hourly chart (only a double-top on the daily chart), after barely overcoming the 1292 high of Dec. 27. Is this it? Or is there more to come?
Since, as of Friday, there was no clear sell signal, it is possible that we could go a little higher or, at least, continue to work a little longer at expanding the top formation. On the P&F chart, the index has already formed a pattern which looks very much like distribution, with trading confined to a 20-30-point range. If prices fail to break out of this range on the upside or, if there is a break-out of a few points with an immediate retracement into the range, it will be a sign that buyers are exhausted and that sellers are getting the upper hand.
Should this happen, we could identify everything above 1266 as a possible top formation which already measures nearly 100 points across (P&F). That means that if that level is broken, we are looking at a potential 100-pt decline in the SPX. That would not be enough to put an end to the intermediate trend which started at 1075 unless, after a re-distribution level is formed, it becomes a possibility if the decline continues beyond 1159.
Let’s not speculate, but take it one step at a time and concern ourselves first with the topping formation, and then with the ensuing decline. We’ll start by analyzing the developing top formation on the Daily SPX Chart.
Chart analysis
Don’t expect to see a potential 100-point top on this chart. It’s the business of the P&F chart to show that. What we do see here, is a larger trend which started at the beginning of October (3-yr cycle low) from 1303, which is delineated by the purple channel lines, and which, as of last Thursday, was still making new highs.
Within that larger uptrend, there are several smaller ones, beginning with a spectacular four-week rally from 1203 to 1292 whose high was only bested last week – barely! Since then, the trend has been essentially sideways having, at best, a vague resemblance to an inversed Head & Shoulders pattern. If it is, we should only get a minor pull-back to the neckline (not shown) and then resume the uptrend. The SPX could also be making a broad consolidation pattern before moving higher.

For now, the last short-term uptrend from 1203 appears to be coming to an end. If we turn to the indicators, we can see that the MSO has now been overbought for about two weeks, and that the MACD and the A/D are both showing negative divergence. More importantly, there has been a long-standing P&F projection of 1293-94 created by the base that formed above the 1203 level. This count was filled last week when the SPX moved to 1296. It tried to move beyond that level two more times in the course of the week, but could not and finally fell back on Friday.
Because the SPX has not yet given a sell signal, and because it formed a small re-accumulation level at 1277 (which gives it a potential move to 1299), it is still possible that the index could move a little higher next week. As we will see next, the Hourly Chart indicators are also suggesting that this is possible.
What a beautiful short-term uptrend this is! From 1203, the SPX has moved up in a steady progression of higher highs and higher lows, within a well-defined channel which has yet to be violated. And yet, one could tell, almost from the start, that the extent of the move would be limited. Look at the MACD: from the very first top it started to show negative divergence, and this has become more and more pronounced as the trend moved higher. You can also see how price failed to get to the top of the channel a couple of weeks ago and was followed by a move sideways. For the first tie, on Friday, the SPX broke below the median and almost reached the bottom of the channel.

This loss of momentum is a negative but, according to the P&F, there is still a potential for going a little higher. And look at the indicators! They are oversold and trying to reverse. That puts the odds slightly in favor of re-testing last week’s high, and perhaps even going a little higher.
Cycles
Next week is approximately six months from the July 2011 peaks and could bring about a high.
If we do have a reversal over the next few days, the downtrend could last until the first week in March when the next 15-wk cycle makes its low, along with two other important short-term cycles.
Breadth
As expected, the Summation Index (courtesy StockCharts.com) has continued to move up until its RSI reached the overbought condition. Since both have not yet turned down, it’s another reason to expect a little more from the SPX, either in time or price before it rolls over.
In spite of its current upside momentum, the NYSI is unlikely to make a new high, or even match its previous high. This would create negative divergence to the price, and could be a sign that the SPX is ready for a significant decline.

Sentiment
This is the lowest level that we have seen on the SentimenTrader (courtesy of same) long-term index since the SPX July top, which confirms expectations that we have arrived at an important market top.

For the past few weeks, we have been looking at the weekly chart of the VIX. This week, we’ll look at the Daily Chart instead, because positive divergence has appeared in the price as well as in the indicators -- something that we have not seen for a long time in the VIX -- and you know what that means: it’s reversal time for the SPX! Even by itself, it would be a powerful enough signal, but combined with everything else that we have discussed so far, if you are a bull, you should start feeling a tad uncomfortable.
The positive divergence only shows up in the daily chart, not in the weekly chart. If our past study of the VIX behavior is valid, this should denote a short-term or intermediate-term reversal, not a major top. Besides, the VIX P&F chart is only forecasting a move to about 28 after which it should go through another phase of consolidation. The last important uptrend in the VIX started after a long basing period and went to 48. The current condition does not show any similarity and we should not be looking for a major decline in the SPX; nothing like the downtrend from 1370 to 1075. We will have a better idea of what to expect when the top pattern of the SPX is complete and we can make a P&F projection.

BONDS
The week before last, TLT broke an important trend line, seemingly forecasting a trend reversal that could take it down to 110. But that was a devious maneuver meant to hide its true intentions which are to extend its uptrend, possibly to a new high.
Here is the TLT Daily Chart. Two price channels have been drawn: the more narrow one, which encompasses the uptrend from last February, and the wider one, which has its starting point in April 2010. While the long-term uptrend appears secure, the intermediate trend fooled us into thinking that it might be coming to an end two weeks ago when the index started to trade outside of its lower channel line. But there was no follow-through, and the similarity between the action of TLT and VIX over the past two weeks is suggesting a possible resumption of its uptrend.
This could result in a new high for TLT. What looked like distribution on the P&F chart now looks like re-accumulation instead with a potential for taking the price to 126-127.
The indicators have not yet given a conclusive buy signal, but they have started to reverse from an oversold position. This is a warning that the consolidation is probably over and that another uptrend is about to start. We’ll give it a little more time to make sure!

UUP (Dollar ETF)
This week, we’ll go back to analyzing the weekly chart of UUP where there is no equivocation about the direction of the trend. It’s up! The price has just gone beyond a strong resistance area and made a new high. It has moved within an up channel since mid-August, and is getting ready to challenge its 200-wk MA. The indicators are also in a strong uptrend, even though the MSO is overbought. The MACD is particularly impressive, having just broken above a long-term trend line and continuing to move higher with no sign of deceleration.
The action of UUP appears to confirm what the US dollar P&F chart has been telling us. Between May and August 2011, the index created a base which is projecting a move to 90 (on Friday, the dollar closed at 81.51). There is an interim phase count to 83 which could result in a pause in its uptrend and give the SPX a chance to consolidate.
The dollar/UUP ratio remains fairly constant at about 3.58. When the dollar moves to 83, UUP should be at about 23.20, and at 90, UUP would be at about 25.10, slightly outside of its long-term channel.

GLD (ETF for gold)
The long-term trend in the SPX and in gold are not exact replicas, but they are more similar than not. If there is a noteworthy correction in the SPX, it could affect gold negatively. This confirms what we see when we analyze gold based on its own technical merits.
Analyzing GLD is the same as analyzing gold. GLD is currently in an intermediate downtrend which is incomplete. Although it has recently bounced from 148.27 to 161.62, it is still within the confines of its down-channel. As you can see on the chart, it found support on its long-term trend line from 2008, as well as from a former congestion level created between May and July 2011.
After it made its high of 185.85, the P&F chart created a projection down to a minimum of 143-144 with a maximum of 134. The re-distribution level that formed around 170 confirmed these initial projections. GLD did not initially make it down to its P&F projections because of the support levels mentioned above. But it is very likely that there will be another attempt at meeting these targets before the index is ready to resume its long-term uptrend.
It is unlikely that gold has reached it final high. From the re-accumulation level which occurred between March 2008 and August 2009, we could derive two distinct projections: a minimum move to about 187-189 (the high came near 186), and a maximum move to 233. Therefore, when the intermediate correction is over, GLD should be able to proceed to the higher projection.

Before it is ready to do that, the following should take place:
1 – GLD should, at least, meet its downside target of 143, and perhaps of 134 as well.
2 -- When an intermediate correction occurs, the initial uptrend usually resets to a lesser angle of ascent. By holding on to the long-term trend line, this did not take place. However, moving down to 143-134 would do the trick.
3 – On the P&F chart, the correction should create a re-accumulation base which is substantial enough to give a confirming count to the next higher projection of 233. This has not been done, and could take a while.
For these reasons, the odds are that GLD needs more work in time and price before its correction is complete.
Summary
There is a virtual fanfare of warning signs heralding the arrival of a (perhaps significant) top for the SPX and other equity indices. How significant is a question that we will have to let the market answer in due time.
When the top is complete (perhaps by the end of next week) the P&F chart should give us an estimate of the decline’s extent.
Andre
FREE TRIAL SUBSCRIPTON
If precision in market timing for all time frames is something that you find important, you should consider taking a trial subscription to my service. It is free, and you will have four weeks to evaluate its worth. It embodies many years of research with the eventual goal of understanding as perfectly as possible how the market functions. I believe that I have achieved this goal.
I can’t resist sharing these two subscriber emails that I received recently:
“Hi Andre. I just wanted to thank you for providing the "best" quality service I have ever experienced. I have experienced them all and yours is a "10". You are a great inspiration.”For a FREE 4-week trial, Send an email to: ajg@cybertrails.com.
“Dear Andre, I wanted to let you know that I think your service is excellent and want to keep my subscription going. However, I am not sure of its status. Do I owe you any money - if so how much? I don't want to let it lapse.”
For further subscription options, payment plans, and for important general information, I encourage you to visit my website at www.marketurningpoints.com. It contains summaries of my background, my investment and trading strategies, and my unique method of intra-day communication with subscribers. I have also started an archive of former newsletters so that you can not only evaluate past performance, but also be aware of the increasing accuracy of forecasts.
The above comments about the financial markets are based purely on what I consider to be sound technical analysis principles. They represent my own opinion and are not meant to be construed as trading or investment advice, but are offered as an analytical point of view which might be of interest to those who follow stock market cycles and technical analysis.
Sunday, January 1, 2012
A-Z financial market forecasts for 2012: stocks, gold & silver, currencies, bonds, oil & more
 Happy New Year 2012! Here's a review of forecasts across the financial markets, and we'll cover what we and our go-to featured analysts are seeing; as well as a review of other analysts and approaches that we think our readers will appreciate. Browse these now, and bookmark this post to refer back to from time to time. Odds are you'll even find some ideas and approaches that you may want to give more attention to in the future. The chart first at right here is actually from a cycles projection by Jim Curry (back in Feb. 2011 and still very telling for 2012!), and I'll discuss it in more detail later below. My own general views are based on Fibonacci time and price projections as well as my understandings of Elliott Wave and cycles. These have me bracing for stock market weakness in January, a rise (lower high?) into March, lower again in the summer (June-July), and then I'm less certain right now about a potential rally into late 2012. For KI$$ investing, I've just gone long again on gold and silver, so long as they respect last week's lows, and that should last most or all of 2012. Crude oil could turn bullish, but unless it strengthens fast, I'm tilting bearish on it because it could retest not only the $85 area but even down to $62/65. I'm bearish the euro as it could head toward a Fibonacci retrace level around $112 $XEU. The dollar is tricky because I do expect it to strengthen further, despite the efforts to push it lower; but at some point it may destabilize downward (fueling gold most likely); we'll assess that once we see how it reacts after a rally of perhaps 10%. But since my views are informed by also surveying the contributions of others, let's see what these talented analysts have to offer! For some I'll indicate or include their forecasts; others I'll include as resources.
"A" is for Andre Gratian whose Market Turning Points update we're glad to share each weekend. He's been referencing long-term cycle lows the stock market is heading toward bottoming around 2014. I'll post his next update Monday, so check back to get all his current think on stock indices, the dollar, bonds (TLT) and gold (meantime you can see his most recent update posted here on December 26).
"A" is also for Afraid to Trade, a site by Corey Rosenbloom at http://afraidtotrade.com with his blog at http://blog.afraidtotrade.com. This weekend he's showing a very interesting chart analysis of Google (GOOG) at that blog.
"B" is for Mike Burke - he publishes a weekly Technical Report analysis for the US stock market. It's posted at Safe Haven, and if you read it you can also see his info on how to sign up to receive it weekly by email. Not really the only thing I'd use but a good adjunct to weekly preparation.
"B" is also for the Bradley siderograph which produces turn dates. But I'll put it at the bottom as "Z" for Manfred Zimmel who produces a forecast chart (warning, the highs/lows aren't absolute - only consider the strong dates as turns; I've even seen them result in a continuation twist rather than pure turn). Under Zimmel below, you'll also find Manfred's explanation of the Bradley siderograph.
"C" - hey, a three-fer! Tony Caldaro, ChartsEdge, and Jim Curry. We'll take 'em one at a time. Tony Caldaro is the greatest Elliott Wave analyst of our time, in my humble opinion. He's reinvented it and calls it Objective Elliott Wave (certainly distinguishes his detailed work totally from that discredited permabear Robert Prechter of Elliott Wave International). We're honored to feature Tony's updates here on a regular basis. Currently he's depicting the stock market at a serious juncture, which you can read about and see in his update posted here yesterday.
ChartsEdge by Mike Korell produces keen cycles forecasts for different time frames,. Mike developed unique ways to systemetize the forecasts via a neural network incorporating cycles of varying lengths. He also (for subscribers) incorporates pattern recognition and physics (geomagnetics) for daily and weekly charts that work uncannily well. We're pleased to feature his week-ahead cycle-based forecasts each weekend (and I like to use his daily subscriber charts for intraday trading).
Jim Curry does methodical cycles work. Sometimes he shares a free article that we post. Hey, his February 2011 article was a tour de force with chart projections that are still working! (though his subscriber updates will have been targeting the choppy action since summer). The chart at the top of this article is just one of many you'll want to see in "Stock Cycles Looking for a Peak!" posted 2/22/11 at http://cyclewave.homestead.com/stockcycles.html.
"D" is for DecisionPoint by Carl Swenlin. A solid set of chart work that readers may want to look at from time to time.
"D" is also for Tom DeMark; and interestingly you can often get DeMark signals info for US and other stock markets, even other tradable assets, from Kevin Depew via his Twitter @kevindepew and sometimes that and/or other insights from Joshua Demasi tweeting @joshuademasi.
"D" can also be for Daneric's Elliott Waves at http://danericselliottwaves.blogspot.com/. It's his hobby, so not as complete and rigorous as Tony Caldaro of course. But if you enjoy seeing what it's like to work through Elliott Wave analysis and probabilities, you may enjoy looking at it from time to time. Daneric is talking about a bearish wave 2 up scenario, so that implies a substantial stock market drop looming just ahead! Still, I've gotta say we do turn to Tony Caldaro for Elliott Wave projections, addressed below.
"E" is for the Economic Confidence Modeled pioneered by the iconoclastic Martin Armstrong. It's been awhile since we dug up his updates, but now he's out (literally) and about, and prolific. I have the general understanding that June 2011 bottomed Martin Armstrong's 8.6-year business cycle. That doesn't mean the cycle has to make a higher high, even though the early stage of any cycle is bullish. Note that the next low in that cycle will be in early autumn 2019 (interestingly, some project gold to be bullish, with weak stock markets, into 2020). If you want to study Martin Armstrong's work, including his current and new reports, go to Writings | Armstrong Economics at http://armstrongeconomics.com/martin_armstrong_writings/. Some you may find rather interesting are:
Gold and Reversals, 12/27/11, at http://armstrongeconomics.files.wordpress.com/2011/12/armstrongeconomics-answering-questions-gold-reversals-122711.pdf.
Martin Armstrong's December 27, 2011 report at http://armstrongeconomics.files.wordpress.com/2011/12/armstrongeconomics-financial-border-controls-122711.pdf.
Armstrong's interesting discussion and forecasting levels regarding the demands and prospects for gold, the US dollar, and US bonds in these turbulent times - why they're going up (and what'll make the dollar and bonds go down): http://armstrongeconomics.files.wordpress.com/2011/10/armstrongeconomics-30-yr-rates-record-lows-100711.pdf.
Also his 11/4/11 "Financial Armagedon" report with discussion of debt, currencies, and gold as a hedge and investment including a detailed analysis of gold forecasts for the coming months and years: http://armstrongeconomics.files.wordpress.com/2011/11/armstrongeconomics-financial-armagedon-110411.pdf.
"K" is for Samuel Kress, though it could almost be for Kondratiev, because Kress analyzes long-wave cycles (such as 60 and 120 years). His updates are sometimes summarized by Clif Droke in articles at Safe Haven. Clif has stated that the 6-year cycle peaked around October 2011, and suggests that the stock market may not make a new high before the long-wave cycles bottom in the years directly ahead.
"M" is for the incomparable Raymond Merriman whose public weekly previews we're delighted to feature. If you don't already have his Forecast 2012 book, go to MMACycles.com and get it now. There's a wealth of great forecasting for the stock markets, US bonds, currencies, precious metals, crude oil, and grains, plus other bonus features like forecasts for the US presidential elections, the US and the world socionomically for the years ahead, the Federal Reserve, and annual horoscope forecasts for individuals under the various astrological signs. Fascinating stuff.
"M" is also for McClellan - we greatly appreciate using the Oscillator and Summation Index invented by McClellan ... Did you know they have a website? Maybe I won't agree with them 100% but they're doing a lot of great work. Check out their latest "Copper Weakness Is a Warning Sign - Free Weekly Technical Analysis Chart - McClellan Financial" sounding, a warning based on weakness in "Dr. Copper" at http://www.mcoscillator.com/learning_center/weekly_chart/copper_weakness_is_a_warning_sign/. But copper isn't gold - see their post earlier this year, One to Three Years Left For Gold's Run - Free Weekly Technical Analysis Chart - McClellan Financial, at http://www.mcoscillator.com/learning_center/weekly_chart/one_to_three_years_left_for_golds_run/.
Another to consider is Marty Chenard who has a website service and occasionally posts at SafeHaven. His work is good but he isn't very open in public about forecasts for the future.
"M" is definitely also for Mr. Top Step, veteran traders of the ES_F (S&P futures), bonds and more, and if you're seriously trading you'll want to follow those tweets @mrtopstep.
"N" is for the Najarian brothers, Jon and Pete (yes, same as on CNBC's Fast Money, and along with Rick Santelli (also a veteran featured on CNBC many mornings), in the movie Floored). Again, if you're seriously trading, you'll want to keep in touch with their optionMONSTER, and tweets via @optionMONSTER and especially @optionMONSTERfd.
"O" is for the Outlook, that is, the Monday Morning Outlook posted (and can be received by emails) by the excellent Todd Salamone and of course Bernie Schaeffer and increasingly Rocky White at Schaeffer's Investment Research. Todd Salamone helps keep and eye on the technical and sentiment backdrop each weekend, mainly for the US stock markets.
"P" could be for Phil Davis who has his Phil's Stock World website with subscriber services, and occasionally posts at SeekingAlpha. His work is very good, but he focuses almost entirely on heavy-duty options trading, and isn't very open in public about forecasts for the future other than for the immediate future.
"P" will also be for Prieur de Plessis whose "Investment Postcards" updates often contain good alerts and interviews. Such as the next one, below:
"R" goes to the venerable Richard Russell. You'll want to know this: “Upside gold crescendo lies ahead,” says Richard Russell « posted at Prieur de Plessis' Investment Postcards from Cape Town, December 31 at http://www.investmentpostcards.com/2011/12/31/upside-gold-crescendo-lies-ahead-says-richard-russell/. Russell also issued a bearish alert on the stock market recently, indicating he doesn't expect it to make new highs.
"R" can also be for Alex Roslin who creates trading signals for 8 markets (SPX, Nikkei, gold, oil, natural gas and more), at his http://www.cotstimer.blogspot.com, using the weekly Commitments of Traders reports. He's improved his analysis and signals during the four years he's been posting and you'll want to keep an eye on his signals.
"S" we'll assign to Sentimentrader - they produce a neat gauge each day ( which Andre Gratian includes often in his reports). They also have other free and paid services, including a blog and a Twitter (I do follow them on Twitter).
"T" has to go to Terry Laundry with his trademarked "T Theory™" (incorporating breadth/strength analysis) as well as incorporating some cycles has definite opinions regarding the path of the stock market, gold, and US Treasury bonds. Yes, he's talking about a projected low date in January, and has thoughts about price and time both then and as 2012 will progress. Terry also has projections for stocks and gold (and probably bonds) that go out for years ahead. You can hear Terry's free T Theory weekend updates at http://www.ttheory.com/observations.php, which also has a link to his free public charts at Stockcharts.com.
"V" is definitely for VIX and More, analysis by Bill Luby on the volatility index. You can follow his VIX signals and informative discussions at http://vixandmore.blogspot.com, and via Twitter too. Anything you want to know about how the VIX works, "and More", you can learn there.
"Z" is for Manfred Zimmel with his work on the Bradley siderograph, at Zimmel's Amanita Market Forecasting site. Here's a quote of his Bradley chart discussion at http://www.amanita.at/FAQ/FragenzumBradley-Siderograph/Bradley-Siderograph/
The Bradley [astrology-based] siderograph was developed in the 1940'ies by Donald Bradleyto forecast the stock markets (link book). Bradley assigned numerical values to certain planetary constellations for every day, and the sum is the siderograph. It was originally intended to predict the stock markets. The noted technical analyst William Eng singled out the Bradley model as the only 'excellent' Timing Indicator in his book, "Technical Analysis of Stocks, Options, and Futures" (source: Astrikos).It is crucial to understand what the siderograph is about since many traders (and even financial astrologers) misunderstand it. Over the decades it has been observed that the siderograph can NOT (!!!) reliably predict the direction but only turning points in the financial markets (stocks, bonds, commodities) within a time window of +/- 4 calendar days (in some cases up to +/- 1 week with the exception of Amanita pivots (+/- 1-2 days). Inversions (i.e. a high instead of a low and vice versa) are quite common.
In 2011 the Bradley siderograph could not beat random probabilities by much, when taking all turning points into considerations. Only the major turning points (bold & large in the chart) continue to be valuable timingtools *today*.
2011
2012
This is the Bradley standard model (original formula according to Donald Bradley) from December 2011 through January 2013:
In 2012 there are 4 major turning points:
- March 3, 2012
- June 12, 2012
- July 28, 2012
- December 22, 2012
Strictly speaking the siderograph dates are potential turning dates, bifurcation points in the language of chaos theory. In addition to the standard model there are 3 other models in the premium area, which may be quite different. All Bradley analyses in the free area since 2007 can be found here.
Raw data for your own research
Premium subscribers of Amanita Market Forecasting get the data of the four Bradley models for the period 1990-2020 as a .txt file (click here to subscribe). Another possibility: you calculate the data yourself with the aid of a financial astrology software ('Financial astrology is the use of astrology to analze and forecast the financial markets. Here financial astrology is understood primarily as an empirical-statistical discipline. The probably first financial astrologer in history was Thales of Miletus who is viewed as the father of science and philosophy (together with Aristotle). With the aid of astrology Thales foresaw an excellent olive harvest, so he hired all olive presses that he lent out with a huge profit, which made him a rich man.') - please go to the software-page. I mainly use the Market Trader von Alphee Lavoie, which is too expensive for the average hobby researcher though.


Enjoy the forecasts and educational analysis offered by the above array of great folks - it's enough to last you through 2012 in more ways than one! There certainly are others who do great work, I'm not intending to diss anyone by exclusion. I'm just including those that either we consistently refer to (readers will recognize as such here over time), or that I know my readers will find interesting for their views and/or analysis. I may augment this later this weekend and as the year progresses. Happy New Year all!
Monday, December 27, 2010
Crude oil tests key Fibonacci level so brace for likely reaction
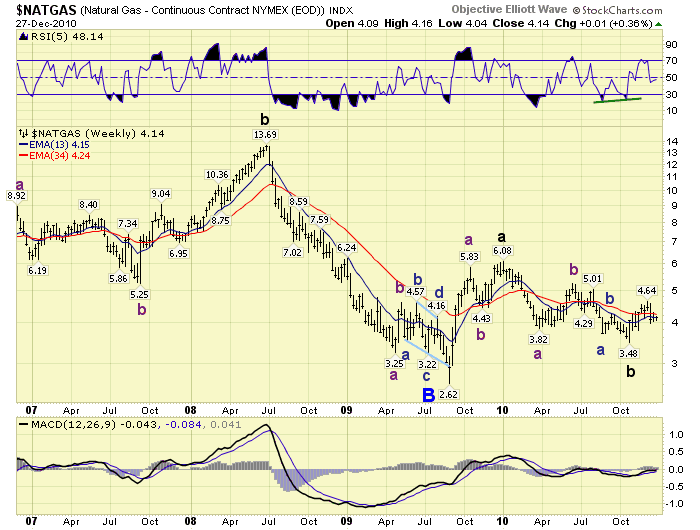
Right in this Bradley turn date window, crude oil has tested up to the $91.52 level in WTIC that represents the Fibonacci 50% retracement to the prior all-time peak which I've been describing. Now that it's made this level, traders need to be alert for reaction. I've come to join those long-term bullish on oil (and see Tony Caldaro's two charts at bottom, on oil and natural gas - thanks again, Tony!), so the basic idea is that it'll push higher. But given the choppy advance, the Fibonacci level in this turn time window, and the overall weak economy, it's reasonable to expect a reaction that goes into a consolidation or correction. My daily and monthly charts of $WTIC are below, and the indicators are consistent with the possibility of a pullback.
It'll be bullish if oil pulls back, then returns to turn this Fibonacci level into support. But for now, we should respect that it's likely to represent a resistance level.
Tony Caldaro's charts, shown at bottom, suggest that both oil and natural gas have higher wave counts ahead. It's almost easier for me to see it in natural gas, since I could almost see the oil wave counts more bearishly (like a huge b-wave bear flag) - that's part of the reason for my issuing this post.
It'll be bullish if oil pulls back, then returns to turn this Fibonacci level into support. But for now, we should respect that it's likely to represent a resistance level.
Tony Caldaro's charts, shown at bottom, suggest that both oil and natural gas have higher wave counts ahead. It's almost easier for me to see it in natural gas, since I could almost see the oil wave counts more bearishly (like a huge b-wave bear flag) - that's part of the reason for my issuing this post.


Wednesday, December 1, 2010
Bradley model turn dates can move the market; Manfred Zimmel's 2011 forecasts
Bradley model turn dates like early Nov. 2010 can work, as we saw this year. Some work better than others, and we always like to be aware when there's one in the vicinity. Manfred Zimmel's free public versions show the dates, although the direction is often "not right" - that's okay because the Bradley model does not predict direction. Only the existence of a tuen date. So what might they show for the year 2011 forecasts? Manfred Zimmel with his Amanita Market Forecasting has published another public (free) version of the Bradley model turn dates. As always his newsletter containing this is a walk on the wild side ... Get on his mailing list for that and see for yourself! At his site, http://www.amanita.at/
Below is a partial quote you'll see at that webpage (links below go to his site):
=============

Friday, November 19, 2010
Sentiment and technical status of the stock market following volatile opex week: it's not over yet
Here's a quick recap of how my favorite sentiment and technical strength indicators look following a volatile opex week! Starting with the volatility index ($VIX), it looks like it's once again testing trendline and Bollinger Band (especially on the weekly) support on both my daily and weekly charts. The weekly chart in particular is interesting, because it shows that VIX has made a higher low within a "triangular" set of trendlines even though the stock market has been testing relatively new highs. That's typically a bearish signal. It doesn't mean that the market is about to crash horribly, but it is a warning that the correction we've seen since last week's crest may not be over yet. Next after that, you'll see my daily and weekly charts of the equity-only put-call ratio ($CPCE). After plumbing the low from which the stock market dropped and the CPCE rose, it's snapped back to somewhat normal levels including a fairly stable moving average level on the weekly chart - this one's less telling than the VIX about next moves, but it can support the notion that the CPCE needs to rise higher (with the stock market moving lower) before it's giving a buy signal.
Check out the McClellan Oscillator chart for the NYSE ($NYMO) - and I also include the Summation Index ($NYSI) in a lower window of that chart. You can see that the Oscillator bounced up from a trendline, coincident with the bounce from the intraday low on Wednesday, and snapped back toward potential resistance in the area of the zero line and trendline re-testing. When you look at the chart, you'll see that the McClellan Oscillator was showing negative divergence for a long time going into the top last week. The next really good buy will display positive divergence. More concerning is the fact that the Summation Index has dropped below its moving average as I've marked (with a red circle) in the lower indicator window. The Summation Index is a longer-term indicator and so this suggests that the correction may have longer to go.
Then at the bottom, there's the TRIN. It's quite interesting that its 10-day moving average is still above 1.2 which means it's technically oversold, but the other moving averages are under that level and so its the TRIN value itself. This is after the TRIN had snapped up from the very overbought conditions of some days ago. Notice that the big "sell" last week was from a higher low in the TRIN - I find this rather common, and it also suggests that a more significant "buy" signal may well come when the TRIN is at a lower high.
All in all, it looks to me as if the market has made a very nice bounce from a very oversold condition, but the volatility is probably not over yet. It's also true that I keep in mind Terry Laundry's T Theory(tm), among other indications, which suggests that the crest last week was potentially very significant with a correction that should last longer than one week. His charts at his T Theory (tm) website (always in the list at right) have been suggesting for quite a while now that a low of some sort should occur later in November or even in December. This overall thinking definitely affects my point of view. So - sure, the market could surprise me to the upside ... but these sentiment and technical charts are indicating to me that the correction actually should not be over yet.
PS - after posting this, I browsed over the COTs Timer blogspot (also in the list at right) and I see that Alex Roslin has posted this today: Selloff May Not be Over. Hey, I didn't coordinate the title of my blog post with him - but clearly he's got the same idea, based on looking at the latest commitments of traders (COT) data! Which of course I think is pretty neat so I'm posting this reference to his blog post.
PPS - for those who like charts, as well as the cycles on Bradley siderograph model - take a look back at my post entitled Stock market possibly cresting before October 25 Bradley model "turn date" window from October. Sure, the topping crest didn't happen then - it actually occurred around the time frame of the more important Bradley turn window Nov. 15-16, also marked by a time series high-low-low-high that I placed on a chart of the $SPX in that post. Again, not a guarantee that the correction must last longer, but adding to the technical evidence that the crest we saw last week going into this turn window may take a longer time period to correct.


Check out the McClellan Oscillator chart for the NYSE ($NYMO) - and I also include the Summation Index ($NYSI) in a lower window of that chart. You can see that the Oscillator bounced up from a trendline, coincident with the bounce from the intraday low on Wednesday, and snapped back toward potential resistance in the area of the zero line and trendline re-testing. When you look at the chart, you'll see that the McClellan Oscillator was showing negative divergence for a long time going into the top last week. The next really good buy will display positive divergence. More concerning is the fact that the Summation Index has dropped below its moving average as I've marked (with a red circle) in the lower indicator window. The Summation Index is a longer-term indicator and so this suggests that the correction may have longer to go.
Then at the bottom, there's the TRIN. It's quite interesting that its 10-day moving average is still above 1.2 which means it's technically oversold, but the other moving averages are under that level and so its the TRIN value itself. This is after the TRIN had snapped up from the very overbought conditions of some days ago. Notice that the big "sell" last week was from a higher low in the TRIN - I find this rather common, and it also suggests that a more significant "buy" signal may well come when the TRIN is at a lower high.
All in all, it looks to me as if the market has made a very nice bounce from a very oversold condition, but the volatility is probably not over yet. It's also true that I keep in mind Terry Laundry's T Theory(tm), among other indications, which suggests that the crest last week was potentially very significant with a correction that should last longer than one week. His charts at his T Theory (tm) website (always in the list at right) have been suggesting for quite a while now that a low of some sort should occur later in November or even in December. This overall thinking definitely affects my point of view. So - sure, the market could surprise me to the upside ... but these sentiment and technical charts are indicating to me that the correction actually should not be over yet.
PS - after posting this, I browsed over the COTs Timer blogspot (also in the list at right) and I see that Alex Roslin has posted this today: Selloff May Not be Over. Hey, I didn't coordinate the title of my blog post with him - but clearly he's got the same idea, based on looking at the latest commitments of traders (COT) data! Which of course I think is pretty neat so I'm posting this reference to his blog post.
PPS - for those who like charts, as well as the cycles on Bradley siderograph model - take a look back at my post entitled Stock market possibly cresting before October 25 Bradley model "turn date" window from October. Sure, the topping crest didn't happen then - it actually occurred around the time frame of the more important Bradley turn window Nov. 15-16, also marked by a time series high-low-low-high that I placed on a chart of the $SPX in that post. Again, not a guarantee that the correction must last longer, but adding to the technical evidence that the crest we saw last week going into this turn window may take a longer time period to correct.


Thursday, October 14, 2010
Stock market possibly cresting before October 25 Bradley model "turn date" window
Various stock market analysts refer to the Bradley "cycles" siderograph model from time to time, and there's another "turn date" time window approaching so let's review it. The most important thing to know about the Bradley model is that the identified dates are not necessarily market highs or lows, but dates when the market is likely to turn. Also be aware, the turn might only be temporary! Finally, some of the turn dates are more important than others. The October 25 date is not one of the important ones so its effects are more likely to be muted. Also, the dates are considered to operate within plus or minus 7 days. So looking back, we might even have a debate about whether it produces a low or a high! Well, this one does have some likelihood of being a low. I say this because the October 18-20 time frame is mentioned as a probable low by "Parker B" (@PositionSizing) whose good technical analysis is being posted sometimes now by Terry Laundry at Terry's T Theory website (http://www.ttheory.com/, see link in the sites list at right), on the basis of studying advance/decline data. And Andre Gratian whose Market Turning Points updates are featured here regularly (see his site also, in the list at right, and his update posted here Monday evening) has identified a cycle low expected to occur next week too. So this gives me more confidence to point out this Bradley turn date time window as well.
I've written about the Bradley model several times before, including in this post: Stock market cycles on Bradley model: how to use and not use this forecasting info (11/24/09); use the "Cycles on Bradley model" to see prior posts referring to this model. One of the most avid Bradley model cycles analysts is Manfred Zimmel, who writes about it at his http://www.amanita.at/ website. Manfred publishes a public version (see below), but don't rely on it too heavily - he also publishes an elite version (in which he incorporates his own refinements) that must be paid for and clearly Manfred feels his own proprietary version is better.* I sure hope so, because the public version doesn't map out a good stock market forecast, even though the turn dates do typically correspond to SOME kind of a stock market turn!
*I will tell you, that back in the March 2009 time frame, Manfred was calling for a magnificant stock market rally to last a long time. Okay - he was right!!
Manfred has also commented at least once, that his public version may work better for the oil price. Well, once again I don't know that we can rely on that for future forecasting purposes - but it is interesting to consider, at least if you're trading oil futures or ETF's (or maybe oil companies).
So, now you know a few things about this mysterious "Bradley model" that people talk about, and click that link to my prior post to research more information about it. Above all, please don't take the graphic depiction (copyright Manfred Zimmel, below) as a forecast - just be aware of the turn dates, and that any turns might only last a relatively short amount of time. The November 15-16 turn date will be more significant, as Manfred marked it in bold. Regular readers of this blog know that's a time frame we're interested in because of Terry Laundry's T Theory (tm) work currently suggesting a crest in the November 6-10 time frame. While there are others (including recently Raymond Merriman) thinking the market will march higher into March 2011, it's possible the market will indeed crest in early-to-mid-November. And then we'll see whether or not it can recover afterward to move higher or if that'll be that.
Speaking of the time frame into early/mid-November, here's another chart I marked up, it's the Dow Jones Industrial Average and I posted it earlier this evening at my UBTNB3 blog at this post: Cyclicality in Dow Jones Industrials. I won't repeat everything about it here, you can click that link to see what I'm saying about it. The chart below says some of it - there's a certain rough periodicity that looks like it may go along with that early/mid-November time frame:

I've written about the Bradley model several times before, including in this post: Stock market cycles on Bradley model: how to use and not use this forecasting info (11/24/09); use the "Cycles on Bradley model" to see prior posts referring to this model. One of the most avid Bradley model cycles analysts is Manfred Zimmel, who writes about it at his http://www.amanita.at/ website. Manfred publishes a public version (see below), but don't rely on it too heavily - he also publishes an elite version (in which he incorporates his own refinements) that must be paid for and clearly Manfred feels his own proprietary version is better.* I sure hope so, because the public version doesn't map out a good stock market forecast, even though the turn dates do typically correspond to SOME kind of a stock market turn!
*I will tell you, that back in the March 2009 time frame, Manfred was calling for a magnificant stock market rally to last a long time. Okay - he was right!!
Manfred has also commented at least once, that his public version may work better for the oil price. Well, once again I don't know that we can rely on that for future forecasting purposes - but it is interesting to consider, at least if you're trading oil futures or ETF's (or maybe oil companies).
So, now you know a few things about this mysterious "Bradley model" that people talk about, and click that link to my prior post to research more information about it. Above all, please don't take the graphic depiction (copyright Manfred Zimmel, below) as a forecast - just be aware of the turn dates, and that any turns might only last a relatively short amount of time. The November 15-16 turn date will be more significant, as Manfred marked it in bold. Regular readers of this blog know that's a time frame we're interested in because of Terry Laundry's T Theory (tm) work currently suggesting a crest in the November 6-10 time frame. While there are others (including recently Raymond Merriman) thinking the market will march higher into March 2011, it's possible the market will indeed crest in early-to-mid-November. And then we'll see whether or not it can recover afterward to move higher or if that'll be that.

Speaking of the time frame into early/mid-November, here's another chart I marked up, it's the Dow Jones Industrial Average and I posted it earlier this evening at my UBTNB3 blog at this post: Cyclicality in Dow Jones Industrials. I won't repeat everything about it here, you can click that link to see what I'm saying about it. The chart below says some of it - there's a certain rough periodicity that looks like it may go along with that early/mid-November time frame:

Friday, October 1, 2010
Negative divergences cropping up as stock market tests time & price symmetry on Bradley turn date window
Folks, the rise off the 1040 $SPX area was expected but we weren't totally prepared for how far, how fast - well, at least some of us were not, yet some of us were more bullish! But where are we now? Andre Gratian pointed out that yesterday was a Bradley turn date, and those normally have a time window of a couple of trading days either way. On the $SPX chart below, I show how we've also tested almost exactly a time and price symmetry if this is finishing the upward "C" wave of an ABC zigzag, where that last testing of the 1040 level was a B wave low. The "A" wave up took 25 trading days, and the "C" wave has been 24 trading days so far. Price symmetry would be just pennies above 1058 in the $SPX and we almost touched it yesterday. Therefore, IF this ABC zigzag is the right way to see the market now (and it might not be the right way - though it corresponds to Tony Caldaro's alternative Objective Elliott Wave count, and I do feel the ABC idea has some merit), then the market is readying for another substantial drop. How far? Well ... if you're using Tony's alternative wave count, then the $SPX could test down perhaps to the 940 area .... However, if you're more bullish than that (like his primary count), then you might be thinking of a nice pullback perhaps to the 1105 $SPX level (or maybe not even that low).
We've also got reasons that Terry Laundry has been posting at his T Theory site (see the sites list at right) for expecting one more rise into the November 6 through 10 time window, after whatever pullback we get, and honestly I wouldn't want to predict right now whether a rise into early November would produce a higher high or a lower high.
If you're uber-bearish then you're counting the rise we're seeing now as the C wave of a larger ABC "second wave up" that will roll over into a wave 3 down (maybe even a Prechterian wave 3 of 3!). I'm not really thinking that. Still, I am positioning defensively and look at the negative divergence I've marked on the $SPX chart, below. Also check out the Nasdaq ($NDX or $COMPQ) advance-decline chart further down ($NAAD) - people are always talking about and charting the NYSE ($NYA) advance-decline ($NYAD), but it's a bit flawed in my opinion because it includes bonds as well as equities so not as pure for charting advance-decline data for stocks. You can also see the McClellan Oscillator in the charts below, as an indicator, both for the NYSE ($NYMO) and the Nasdaq ($NAMO). In both cases, the McClellan Oscillator is testing its own moving average.
There's a sentiment indicator that works by looking at the COT (Commitments of Traders) data - I keep links for that in the sites list at right side of the page here. I haven't referred to it in a while. But check out this article, "Smart Money" S&P 500 Traders Abandon Ship (COTs Timer, 9/25/10) - Alex Roslin has some very interesting techniques for trading using COT data, and he's mentioning October 4 as a turn date which would even get the stock market to the 25th trading day I mentioned (regarding the time symmetry, above). I don't know if we'll see it tag 1058 in the $SPX and I'm just as happy to work off the time symmetry. I've also wondered if there's a bearish wedge that formed on the hourly charts but I don't think it's so well-formed that it's worth showing at this time.
Now, we're going to look forward to seeing updates this weekend from other talented analysts, including Andre Gratian of course with his Market Turning Points update, and others such as Tony Caldaro and Terry Laundry. Meantime, I must also point out that the QQQQ has found resistance in the area of $49.60 which is a Fibonacci .786 retracement to the April highs. So even though the stock market and the QQQQ's have broken out in a manner that triggers bullish point and figure (P&F) projections, there are Fibonacci reasons as well as the negative divergences to think that some level of a pullback or correction is coming. We should get good clues from the market movements over the next week or so on what type or level of correction it is and what it may mean for the markets for the rest of the year.


We've also got reasons that Terry Laundry has been posting at his T Theory site (see the sites list at right) for expecting one more rise into the November 6 through 10 time window, after whatever pullback we get, and honestly I wouldn't want to predict right now whether a rise into early November would produce a higher high or a lower high.
If you're uber-bearish then you're counting the rise we're seeing now as the C wave of a larger ABC "second wave up" that will roll over into a wave 3 down (maybe even a Prechterian wave 3 of 3!). I'm not really thinking that. Still, I am positioning defensively and look at the negative divergence I've marked on the $SPX chart, below. Also check out the Nasdaq ($NDX or $COMPQ) advance-decline chart further down ($NAAD) - people are always talking about and charting the NYSE ($NYA) advance-decline ($NYAD), but it's a bit flawed in my opinion because it includes bonds as well as equities so not as pure for charting advance-decline data for stocks. You can also see the McClellan Oscillator in the charts below, as an indicator, both for the NYSE ($NYMO) and the Nasdaq ($NAMO). In both cases, the McClellan Oscillator is testing its own moving average.
There's a sentiment indicator that works by looking at the COT (Commitments of Traders) data - I keep links for that in the sites list at right side of the page here. I haven't referred to it in a while. But check out this article, "Smart Money" S&P 500 Traders Abandon Ship (COTs Timer, 9/25/10) - Alex Roslin has some very interesting techniques for trading using COT data, and he's mentioning October 4 as a turn date which would even get the stock market to the 25th trading day I mentioned (regarding the time symmetry, above). I don't know if we'll see it tag 1058 in the $SPX and I'm just as happy to work off the time symmetry. I've also wondered if there's a bearish wedge that formed on the hourly charts but I don't think it's so well-formed that it's worth showing at this time.
Now, we're going to look forward to seeing updates this weekend from other talented analysts, including Andre Gratian of course with his Market Turning Points update, and others such as Tony Caldaro and Terry Laundry. Meantime, I must also point out that the QQQQ has found resistance in the area of $49.60 which is a Fibonacci .786 retracement to the April highs. So even though the stock market and the QQQQ's have broken out in a manner that triggers bullish point and figure (P&F) projections, there are Fibonacci reasons as well as the negative divergences to think that some level of a pullback or correction is coming. We should get good clues from the market movements over the next week or so on what type or level of correction it is and what it may mean for the markets for the rest of the year.


Wednesday, September 29, 2010
Bradley date Sept. 30 might bring near-term change in stock market movement: Turning Points update by Andre Gratian
The stock market support about 1140-1143 in the S&P 500 looks hugely important now, so I'm interested to see how the market internals and technicals look to Andre Gratian. Andre has done it again with an in-depth review of the stock market's health including technical strength indicators, sentiment, trendlines, point & figure projections, Fibonacci, wave analysis and cycles. It's market analysis combined in a very readable, cogent report. I'm only sorry my schedule prevented me from getting it posted over the weekend! This week he's again included another update about gold. Andre publishes and operates the excellent Market Turning Points which you can always find in the list at right, and info available via the links with his article below. Thanks again Andre for sharing this with our readers.

This update article is also as it appears at Turning Points | Andre Gratian | Safehaven.com, see http://www.safehaven.com/article/18330/turning-points
Turning Points
By: Andre Gratian | Sun, Sep 26, 2010
Precision timing for all time frames through a 3-dimensional approach to technical
analysis: Cycles - Breadth - P&F and Fibonacci price projections
"By the Law of Periodical Repetition, everything which has happened once must happen again, and again, and again -- and not capriciously, but at regular periods, and each thing in its own period, not another's, and each obeying its own law... The same Nature which delights in periodical repetition in the sky is the Nature which orders the affairs of the earth. Let us not underrate the value of that hint." -- Mark Twain
Current Position of the Market
Very Long-term trend - The very-long-term cycles are down and if they make their lows when expected, the bear market which started in October 2007 should continue until about 2014-2015.
SPX: Intermediate trend. The S&P 500 index ($SPX) has closed outside of its downtrend line. The move signals a new intermediate uptrend, or the continuation of an intermediate sideways consolidation.
Analysis of the short-term trend is done on a daily basis with the help of hourly charts. It is an important adjunct to the analysis of daily and weekly charts which discusses the course of longer market trends.
Daily market analysis of the short term trend is reserved for subscribers. If you would like to sign up for a FREE 4-week trial period of daily comments, please let me know atajg@cybertrails.com.
Overview:
It is possible that a cyclical bull market, within a secular bear market, began in March 2009. Some uncertainty will remain until the SPX has surpassed its 1219.80 high of late April 2010, but the action of the past few weeks is telling us that the decline from that level may only have been an intermediate correction and not a resumption of the 2007-2008 bear market. Whether or not it was and how long it will last are questions that cannot be answered at this time.
The market action is clarifying another area of uncertainty: the 4-yr cycle may have bottomed in July 2010, along with the 2-yr cycle, just as it did four years ago in 2006. An even greater possibility is that it did so in late August. Whichever date it was, the current market strength is telling us that it is likely behind us. If it were still expected in October, we would be experiencing much more weakness. Any decline which takes place into the middle of next month will be caused by the combined action of the 9-mo and 17-wk cycles making their lows.
The index is currently trying to form a short-term top, but it is having some difficulty doing it. You'd think that after filling the Point & Figure count at 1148 it would have started to decline -- and it did, but after a paltry 2- day pull-back of 16 points, it recouped it all plus a little more on Friday.
Once again, we have been shown the value of P&F projections. I had determined that the base formation just above 1040 had a count to 1148 with a possible extension to 1168. The high last Tuesday was 1148.59. The fact that the base has a potential for 20 more points may be the reason why the index is having trouble getting something going to the downside. Another reason may be that the Bradley date of 9/30 is acting as a magnet, and that the reversal will not take place until next Thursday. You'd think that the poor breath statistics of the past week would have led to a sharp pull-back. But instead, it made a new high Friday, if only by a fraction -- and the NDX is even stronger and almost ready to challenge its April high.
Let's look at the charts!
Analysis
Chart Pattern and Momentum
We'll start by analyzing the Daily Chart of the SPX. The picture it provides is very clear, except for the very near-term. The intermediate correction from 1220 came to an end when the index broke out of its red channel and subsequently rose above its last high of 1129.24. Since its low of 1011 in early July, it has started to make a pattern of higher highs and higher lows, and this has brought it to an area of resistance at the top of the black channel which I have drawn on the chart.
Furthermore, when it reached 1148, the index filled its minimum P&F projection, which normally leads to profit-taking and a pull-back. These two factors combined should produce some sort of a top. In addition, there was a potential projection into this time frame. This is marked on the chart by two vertical line with the red "top" written above.

You will also notice that the brown breadth indicator (at the bottom) has been showing significant negative divergence to the price pattern for the past week. So why didn't the market continue down on Friday instead of rallying to a slightly new high? If you look at the top (blue) momentum indicator you will see that, until last Tuesday, it was overbought but did not sport any negative divergence. After Friday's rally, the negative divergence which has begun to appear is minimal. But the green momentum indicator has none! That tells us that we may spend a couple more days building this top, or the index could decide to go and fill its 1168 base projection extension before reversing. As mentioned in Overview, the market could also be under the influence of the 9/30 Bradley date and continue to rise until then. In other words, it's too soon to draw a definite conclusion about the near term market position. The next couple of days will tell us exactly where we stand.
By rising to a new high on Friday, the index has created a new short-term uptrend line. This trend line will have to be broken on the downside, and confirmation that a downtrend has started will not come until the SPX has closed on an hourly basis below Friday's low of 1122.79.
The drop to 1123 was the result of a small area of distribution which had built up at the first top on the P&F chart.
Let's move on to the Hourly Chart and get a more detailed view. You can see how close the index is to the top of the black channel. I have also drawn a brown channel which delineates the parameters of the phase which started at 1041. The index is still trading in the top half of that channel, which is an indication of strength. However, on Friday it could not rise to the top. If it still cannot do so by Monday or Tuesday and starts to retrace, it will be the first sign of deceleration in the trend, and a sign of weakness.

Earlier, when we analyzed the daily indicators, we saw that those which track momentum were the strongest, and breadth was the weakest. On the hourly chart, we have the exact opposite, with breadth being the strongest on Friday. Until all indicators are in agreement, we are probably not ready for a reversal. It is not easy to come up with a valid P&F projection from the 1123 reversal point, but I can make out a potential 1151 and 1156.
Cycles
As discussed earlier, there is some strong evidence that the 4-yr cycle has already made its low.
The 9-mo and the 17-wk cycles should both make their lows near 10/18.
Projections
The base projection of 1148 was reached last Tuesday. There is still a potential P&F projection to 1168 and a Fibonacci projection to 1175.
The very near term could carry to 1151 and perhaps 1156.
Breadth
The NYSE Summation index (courtesy of StockCharts.com) continues to show strength. This bodes well for the intermediate uptrend.

On the other hand, my daily A/D indicator has reflected a lack of support for price over the past week.
Market Leaders and Sentiment
The SentimenTrader (courtesy of same) has slowly been moving away from its former bullish condition, and has begun to show some negativity. But it is not yet close to giving us readings that are associated with an important market top. Any such warning would have to be accompanied by similar signals from other indicators. At this time, there are none. In fact, as you can see by the next indicator, it's quite the opposite.
The NDX/SPX ratio (courtesy of StockCharts.com) has improved sharply over the past two weeks. This is a positive for the market.

Gold
By touching 127 last week, GLD is now close to its original projection of 128. A confirming count of 128/130 can be established from the re-accumulation pattern around 116/117. This makes a reversal from the projection area highly probable.
Bulls should be aware that GLD has a tendency to reverse suddenly and with little warning once it reaches its target, especially when it makes this kind of topping pattern. The move into early December 2009 is a good example of what could happen. A break of the short-term trend line from 113.21 may be the only warning.

 Larger Image
Summary
It now looks as if the SPX started a cyclical bull market in March 2009 and that it completed an intermediate correction at 1011 before resuming its uptrend.
The first phase of the new uptrend ended at 1130, and a short-term correction down to 1041 ensued -- probably as a result of the 4-year cycle making its low.
Since then, an initial target to 1148 has been met, and the index appears to be deliberating whether it should move up to its next projection of 1168 before correcting into the 9-mo/17-wk cycle lows due around 10/18.
There is a Bradley date due on 9/30 which may hold up prices before any short-term reversal.
FREE TRIAL SUBSCRIPTON
If precision in market timing for all time frames is something which is important to you, you should consider a trial subscription to my service. It is free, and you will have four weeks to evaluate the claims made by the following subscribers:
Thanks for all your help. You have done a superb job in what is obviously a difficult market to gauge. J.D.
Unbelievable call. U nailed it, and never backed off. C.S.
I hope you can teach me about the market and the cycles. I want to be like you and be the best at it. F.J.
See if you agree by subscribing to a FREE 4-week trial. Send an email to: Ajg@cybertrails.com
For further subscription options, payment plans, and for important general information, I encourage you to visit my website at www.marketurningpoints.com. It contains summaries of my background, my investment and trading strategies and my unique method of intra-day communication to Market Turning Points subscribers.
All Images, XHTML Renderings, and Source Code Copyright © Safehaven.com
Subscribe to:
Posts (Atom)




 Posts
Posts

