Sunday, June 17, 2012
A contrarian, pro-Treasury bonds point of view
On a Fibonacci basis, it is possible for the US long bond ($USB or the futures /ZB) to actually make higher highs even up to the level of 160. To instead make a downward trend reversal here, it would have to move under 148 and even better 146 on strong selling volumes. We haven't seen that yet. The bond market may be smelling something that many stock investors haven't noticed yet.
Below are daily and monthly charts of the US long bond. I've also added a daily chart of TLT, the ETF that tracks the US long bond. The TLT chart shows that the selling volumes on the recent dip didn't even exceed the buying volumes that preceded during the most recent run up. We would also want to see more negative divergence going into the highest price, whenever "the top" does arrive.
You can see that, although there was a consolidation, a trend reversal pattern has not yet occurred. A trend reversal pattern would require lower lows on increased selling volumes. Until we see that, it's one clue that smart money is remaining in bonds, and may be avoiding stocks. There are even analysts now saying the stock market has topped out, and will only make its own pattern of lower highs the rest of this year and into next year. If that's true, then it supports the idea that US treasury bonds will do well for a long time. Even Martin Armstrong has recently (http://armstrongeconomics.com/693-2/2012-2/mirror-mirror/) explained why, in these uncertain times with other markets drooping and capital fleeing to perceived relative quality, the US dollar and US bonds may be one of the last holdouts of strength; at least until stocks reached whatever bottom they're going to find and finally make a long term cycle low-perhaps sometime next year or in 2014.
A similar discussion about why bonds are holding up so well is available from Terry Laundry in his audio commentary this weekend, at his "Best Bond Strategy" website at http://www.bestbondstrategy.com/.
All in all, given the uncertainties in stock markets and even commodities under pressure, it may not be such a great surprise that US Treasury bonds have proven resilient so far. They may continue to do well in the coming months. And if next year proves to be the significant risky time we've been bracing for, they may hold up into next year as well.
Saturday, June 9, 2012
KI$$ swings can consider gold at these levels: technical charts
The "high pole" the P&F refers to is the strong spike up on Friday. Sure it could mean something to sell, but it could also be the start of the move up. Follow-through will of course be required.
Of course gold investors want the price to soar much higher, such as to the $2200's and beyond. Based on the lengths of the uptrend waves prior to this consolidation, $2300 or more doesn't seem unreasonable. But first gold must break above the channel midlines indicated on the weekly chart, below. Assuming it does indeed get to $1850, some of the position could be taken off (TMAR - "take the money and run") and place a reasonable stop loss under the remainder, at a level that one feels comfortable with.
The weekly chart does show some Fibonacci retracement levels I had marked weeks ago. So far, gold has remained above the $1517 level, and so it may not need to seek the $1392 level. It is possible that gold has been correcting in time rather than price. That's why it came out of the uptrend channel I'd marked, but it's moving sideways in the price channel that's gone horizontal on the weekly chart. Interestingly, this does alternate with the sharp correction that it experienced after it broke above the price highs spike of the 1970's. That sharp correction looked like a handle in a so-called "cup and handle" set-up. Now, the sideways consolidation that has occurred so far could potentially be building a base from which higher highs are possible. We just don't want to see it break decisively below this range. I will say, however, that a quick poke below $1517 could theoretically be acceptable in order to complete the consolidation; but I recognize that most investors would not want to take that risk. So set your trading plan accordingly, as you see fit.
(For example, one approach might be to either await a drop below and rise back above $1517, or alternatively a rise above $1600. There may well be other approaches.). Below are the weekly and daily charts.
Stock market looks okay for KI$$ investors - here's what to watch: technical charts


Don't forget that it remains possible for the stock market to make a lower low in the correction, so one place to watch in the SPX is the 200-day moving average, as well as the 1274 level. Also don't forget that it remains possible that even if the market pushes up to higher levels later this year, there are scenarios in which that could be just another peak that gets sold off into 2013 and 2014. So don't get complacent even if the markets do rally to higher highs.
Below are charts of the NYMO and bullish percent / SPX - two of my favorite indicator charts for KI$$ swings and investors. They both show marked improvement for the bullish case. No guarantee of course, just a basis for cautious optimism. Below that, a monthly SPX chart. Notice the bearish downtrending forkline trendlines - they are one reason why we must see continued higher highs in order to break those levels to be truly bullish. Otherwise, we might only see the market push up into a failed high. So don't get overly optimistic, and do continue to use stop losses and other trade management and money management!


Saturday, June 2, 2012
It's ok, Bill Gross - safe to look at shorting US long bonds now! Chart analysis
NOTE - we still must be on the safe side, and look for a pattern reversal before being aggressive on this. Otherwise, it remains within the realm of possibility that if there is a stockmarket meltdown, US bonds could remain afloat indefinitely as investors seek their safety.
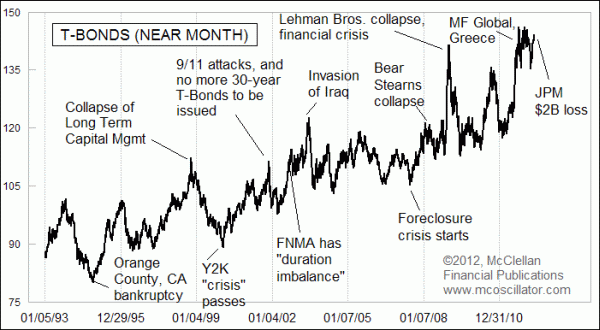
It's quite possible that shorter-term notes like the 1-year, 2-year and perhaps 10-year may hold up relatively better. I'm guessing the longer-dated 20- or 30-year bonds may fall relatively more. By the way, others are taking note including the great folks at MrTopStep.com (tweeting at MrTopStep) as well as a very nice three-decade look at the price resistance by Tom McClellan at http://www.mcoscillator.com/learning_center/weekly_chart/full-on_panic_into_t-bonds/. Since I've already hammered on the topic of waiting until $150 was met before shorting, I'll now start talking about what pullback levels to expect. First, a look at the daily chart of $USB shows that there's support initially about $147, then stronger support around $144 to look for (and isn't 144 such a nice Fibonacci number anyway!). Then around $136 is another retrace/support area; then of course $120 eventually. After price starts dropping under $150, we should start looking for around $144, then look at how it's shaping up. Here's the daily, then there are more charts below.
Below is the monthly chart. Once you start looking at it, you can see that $150 was presaged not only by a Fibonacci "butterfly" after the breakout and point-&-figure (P&F) charting, but also a long-term inverse head-&-shoulders and a symmetrical C=A type of wave structure. The latter gives a Fibonacci "shark attack" pattern pullback target at least to the same $144 level that the bearish butterfly targets. So we must first look for a trend reversal pattern (selling volumes and embarking on lower lows as it moves). This is critical because theoretically it could also go to a higher projection at $160 although that's much less likely. Then on a reversal, we should start to be able to see if it's going into a bigger-picture long-term trend reversal, and what targets come into focus.
Finally, below are daily and monthly P&F charts. Once $USB starts breaking support levels - $136 in particular, and eventually $120 after likely back-and-forth waves and over time - we can calculate more targets for downtrending prices. The trendlines on the P&F charts also suggest support areas. If those hold, then it remains possible to see $160 in $USB. If that happens, then it's still a bearish butterfly setup for a pullback if not a trend reversal.
Oversold stock market retains bullish potential: Tony Caldaro's 6/2/12 OEW update
=============
the ELLIOTT WAVE lives on
June 2, 2012
weekend update
by Tony Caldaro
REVIEW
After a one week gain, and the possibility of a downtrend low, the markets rallied early but broke down late in the week. Fear of an economic slowdown in the US, in conjunction with economic slowdowns in Asia and Europe, fueled the decline. For the week the SPX/DOW were -2.85%, and the NDX/NAZ were -2.95%. Asia managed only a 0.6% decline, but Europe lost 3.7% and the World index was down 2.7%. On the economic front it was a predominently negative week: 4 positives and 13 negatives. On the uptick: the ADP index, construction spending, the monetary base and auto sales. On the downtick: Case-Shiller, consumer confidence, pending homes sales, Q1 GDP, the Chicago PMI, monthly payrolls, personal income, PCE prices, ISM manufacturing, investor sentiment, the WLEI, and both the unemployment rate plus weekly jobless claims increased. Next week we will get reports on ISM services, consumer credit and the FED's beige book. Best to your week!
LONG TERM: bull market
During the spring-summer 2011 correction all but 2 of the 20 world indices we follow turned negative with our Smart $$$ indicator. The only two that remained positive were the US and Indonesia. Flash ahead one year, to the spring of 2012, and wouldn't you know the same two world indices are, as they say, swimming upstream. Naturally, when 90% of the world's markets are under selling pressure it is hard to stay bullish on the remaining two. But cautiously bullish we remain, at least on the US.
Our wave structure and count from the March 2009 low remains relatively the same. We are counting that low as the end of the bear market, and the beginning of a new Cycle wave bull market. Primary wave I of the five Primary wave bull market ended at SPX 1371 in April 2011. Primary wave II bottomed in October 2011 at SPX 1075. Primary wave III has been underway since then. In the DOW we can count five waves up from the Primary wave II low, and we are now accepting these five waves up as a completed Major wave 1. This is our preferred count. Since the SPX, and for that matter the NDX, are mainly futures driven. We can not totally rely on their market activity to define the quantified waves. The DOW, however, is the bellwether and always quantifies the waves perfectly.
The weekly chart above displays the preferred count illustrating five Intermediate waves up into the DOW 13,339 May high. The correction underway now will be counted as Major wave 2. Notice this bull market has been somewhat choppy compared to the 2002-2007 bull market. And, it has been somewhat difficult to track. Nevertheless, our weekly RSI and MACD indicators continue to display positive signs although not as desirable as we would like.
Our alternate count is posted on the SPX charts. This suggests the recent April high at SPX 1422 completed only Intermediate wave i of Major wave 3. It is in fact a more bullish count, suggesting an extension would be underway for Major wave 3. In light of what is unfolding in the foreign markets we believe this has a lower probability.
At the end of the public stock charts, on page 17, we have been carrying these two counts and one less bullish count. This third count suggests the October low only ended Major wave A of Primary II. Then the recent advance to April was Major wave B. Major wave C would now be underway to retest those October lows. We rank this count third lowest in probability. We have just added a fourth count, which is totally bearish. But we consider it a wild card at the moment, and rank it fourth in lowest probability.
One could state the bull market has entered another inflection point. Several possibilities have now arisen, three long term bullish and one bearish. We posted all four counts, in order of preference, at the end of the public stock charts - link at the end of the report. Overall, the market appears to be somewhat risky at the moment, with the break below the OEW 1291 pivot. The next uptrend will be quite important, and probably the determining factor longer term.
MEDIUM TERM: downtrend continues
When we view the current downtrend, in DOW terms, nothing looks unusual. The market advanced in five quantified waves up from the Oct11 low to the recent May12 high. The fifth wave advance was quite weak compared to waves one and three. Now the market is correcting into the range of the previous wave 1 high and wave 2 low. In Dow terms this is 11,232 to 12,284, the DOW closed at 12,119 on friday. In SPX terms this is 1159 to 1293, the SPX closed at 1278 on friday. Both are just entering this range.
Remaining with the DOW count we have the following Fibonacci retracement levels for this correction: DOW 12,200 38.2%, DOW 11,870 50.0% and DOW 11,525 61.8%. Friday's close just dipped below the 38.2% retracement level. The SPX equivalents are the following: SPX 1289 38.2%, SPX 1249 50.0% and SPX 1208 61.8%. The SPX also just dipped below the 38.2% retracement level on friday. The OEW pivots in descending order are: 1261, 1240 and 1222. This suggests there is support at the 1261 pivot, but more important support at the 1240 and 1222 pivots.
SHORT TERM
Support for the SPX remains at the 1261 and 1240 pivots, with resistance at the 1291 and 1303 pivots. Short term momentum is quite oversold. The short term OEW charts remain with a negative bias from SPX 1323, with the positive swing point now around 1310.
When we review the internal structure of this downtrend. It appears we have had five waves down from DOW 13,339 to 12,312 to end Intermediate wave A. Then a small corrective Int. B wave bounce to DOW 12,611, followed by an ongoing five wave decline for Int. wave C. When this concludes, the downtrend should also end. Using the same count on the SPX the structure is similar. A five wave Int. A decline to SPX 1292, an Int. B bounce to SPX 1335, and now a ongoing five wave Int. C decline.
Internal wave relationships suggest the following support levels: at DOW 11,975 Int. C = 0.618 Int. A, and at DOW 11,585 Int. C = Int. A. The equivalent SPX levels are 1259 and 1212. When we combine the Fibonacci retracement levels, (noted in the Medium Term section), with the internal wave structure we still arrive at the same OEW pivots as support: 1261, 1240 and 1222.
Looking a bit closer at this Intermediate C wave, we can see a Minor wave 1 down from SPX 1335 to 1299. A Minor wave 2 to SPX 1320, and a Minor wave 3 currently underway. Naturally to fit the SPX count into the DOW wave structure SPX 1415 would need to be counted as a fifth wave failure, and the correction would have started from that point. Best to your trading!
FOREIGN MARKETS
The Asian markets were mixed on the week for a net loss of 0.6%. All but China are in downtrends.
The European markets were all lower on the week losing 3.7%. All are in downtrends.
The Commodity equity group were all lower, are in downtrends, and lost 1.9%.
The DJ World index is also downtrending losing 2.7% on the week.
COMMODITIES
Bonds had an historic week, as 10 yr yields dropped to an all time low of 1.44%. The 30 year did likewise hitting 2.51%. For the week the uptrending bonds gained 1.4%.
Crude continued its downtrend losing 8.2% on the week. It has now dropped 26% from its spring high of $110.55. Previous spring selloff declines have been between 21% and 34%.
Gold was lower on the week until friday when it soared nearly $60. Friday was its best daily percentage gain since early 2009. For the week it gained 3.1%.
The USD continues to uptrend gaining 0.6% on the week. But it currently displays a negative divergence at extremely overbought levels. The EUR lost 0.7%, and the JPY rallied 2.2%.
NEXT WEEK
Economic reports start on monday with Factory orders at 10:00. On tuesday ISM services, and on wednesday we get a look at the FED's beige book. On thursday, weekly Jobless claims and Consumer credit. Then on friday the Trade deficit and Wholesale inventories in this light reporting week. The FED has three events after weeks of inactivity. On wednesday FED governor Tarullo testifies before the Senate, and the FED vice chair Yellen gives a speech in the evening. On thursday, FED chairman Bernanke testifies before the Senate on the economic outlook and monetary policy. Should be an interesting week. Interesting times!
"Easy short" of SPX probably finished, let's look ahead: technical market strength
But note this - for KI$$ swings, the conscientious approach is to wait until the StochRSI moves to its upper level. The safest KI$$ swings occur when the StochRSI is either solidly up, ow down - not when it's wandering about in the mid-ranges. Here's the chart below (then after it, we'll look at the McClellan Oscillator):
The $NYMO chart showing the McClellan Oscillator for the NYSE index. I include the summation index too, and add trendlines although it's been awhile since I updated them! Look at how the oscillator bounced up after a reverse symmetrical triangle (also called an expanding triangle). On its subsequent drop it remains quite high, especially compared to stock index prices! While it's below zero, the positive divergence is startling. And its StochRSI indicator in the upper window is backtesting its own midline - a clue the oscillator has a good probability of moving higher, taking the stock market with it.
It's true the summation index is still low, so that's still concerning. But it's decelerating and looks ready to start a curl upward again. Even if it just tests its own midline, that'll support a rally, whether or not we see new highs in the markets. So all in all, the point is that traders and investors can look for the market to start finding support and start making a new effort to pattern reverse. A reversal pattern means starting to make higher highs and higher lows. At least for now, these technical indicators say that the market is ready to start working on a bottoming & reversing process.
Saturday, May 19, 2012
New bull-market scenarios based on support break: Tony Caldaro's 5/19/12 OEW update
=============
the ELLIOTT WAVE lives on
weekend update
REVIEW
A nasty week in most of the world's stock markets as the current downtrend extended. The SPX/DOW lost 3.9%, the biggest weekly drop since November, and the NDX/NAZ lost 5.3%. Asian markets were -4.0%, European markets were -5.0%, and the DJ World index lost 5.4%. Economic reports for the week were mixed with negatives edging out positives 7 to 6. On the uptick: the NY FED, the NAHB, housing starts, industrial production, capacity utilization, and the WLEI. On the downtick: retail sales, the CPI, business inventories, building permits, the Philly FED, leading indicators, and jobless claims rose. Next week we will get a look at more housing data, durable goods orders and consumer sentiment. Best to your week!
LONG TERM: bull market
Despite the US market doubling between 2009 and 2011, and making new highs in 2012, this has not been a steady uptrending bull market. Unlike the steady 2002-2007 bull market, see weekly chart below, this one has run into four straight spring swoons to the downside in the past four years. The first one started at the end of the first bull market uptrend, in June 2009. It ended with a 9.1% correction. The second started with the conclusion of Major wave 1 of Primary I, in April 2010. It ended with a 17% correction. The third one started at the conclusion of Primary I, May 2011. It ended with a 22% correction. This fourth one started this April, and has thus far corrected 9.1%. Notice the Jun09 correction was also 9.1%, as was the Jan10 correction. In fact, the 9.1% correction level has marked the end of two of this bull market's six corrections. The other two, not mentioned, were the Feb11 7.4% and Oct11 10.4% corrections. These are noted on the weekly chart.
Our long term count from the Mar09 bear market low at SPX 667 remains unchanged. We counted five Major waves up to SPX 1370 in May11, ending Primary wave I. Then an elongated flat to SPX 1075 into Oct11, ending Primary wave II. Primary wave III has been underway since then. After this week's market action, however, our Primary wave III count has come under some pressure. The slight dip on friday to SPX 1292 momentarily overlapped the previous uptrend high of 1293. On thursday we considered this possibility when we noted there were a few additional potential counts if it occurred.
MEDIUM TERM: downtrending
Currently we are maintaining the Major 1-2-3-4 count posted on the daily chart below. Should the DOW overlap its previous uptrend as well, remember the DOW is the bellwether, then the count will likely require adjustment.
The first alternate count is the most obvious. Primary wave II ended in Oct11 at SPX 1075. Then Major wave 1 and 2 ended at SPX 1293 and 1159 respectively, and the recent uptrend was Intermediate wave i of Major 3 ending at 1422. Intermediate wave ii would be under way now. This would suggest a, worse case, decline into the SPX 1202-1267 area.
The second alternate count is suggested by the bellwether DOW. Again Primary wave II ended in Oct11. Then the market rallied five waves up from that low, in Intermediate waves (i-ii-iii-iv-v), to complete Major wave 1 of Primary III. Remember the DOW had five trend changes, waves, from the Primary II low into its May12 high. This would suggest a, worse case, decline into the DOW 11,232-12,284 and SPX 1159-1293 area.
The third alternative, and least preferred, suggests only Major wave A of Primary II completed in Oct11 at SPX 1075. The advance from that low was an abc Major wave B of Primary II. Major wave C would now be underway to retest that low, and complete Primary II. This would suggest a, worse case, decline into the SPX 1075-1100 area or lower. Certainly this is the worse case scenario.
Keep in mind the overlap that would trigger one of these three alternate counts has not occurred yet. If it does, and considering the current state of the foreign and commodity markets, we would place a 40% probability on each of the first two counts and a 20% probability on the last count. This has been an historically difficult bull market. Should this correction extend into June, we would prefer the DOW count. During this bull market corrections to Major waves or larger have taken from 1 – 5 months, while smaller waves have only taken one month. These charts are all posted at the very end, page 17, of the public stockcharts … link below.
SHORT TERM
Support for the SPX is at the 1291 and 1261 OEW pivots, with resistance at the 1303 and 1313 pivots. Short term momentum is starting to display a positive divergence. The short term OEW charts remain on a negative bias from SPX 1395, with the positive swing level now in the mid 1330′s.
This correction, needless to state, has declined slightly more than our SPX 1300 – 1340 general range, and much more than our SPX 1313 – 1327 expected range. Medium and long term momentum is now at its lowest level since August 2011. The last time the market had this type of selling pressure (2011) it rallied over 100 SPX points in just six trading days. The two previous times, during this bull market, it rallied 90 points in 6 trading days (2010), and 100+ points in 8 trading days (2009).
Remaining with our posted count. It appears this correction has an Intermediate wave A flat followed by an Intermediate wave C zigzag. The wave relationships from the SPX 1422 uptrend high are displaying some equality. Minor a of Int. A dropped 65 points, SPX 1422-1357. Now Minor A and C of Int. C have declined 72 and 74 points respectively. In fact, the total decline for Int. C = 2 x Int. A between SPX 1285 and 1289.
When examining the internal wave structure of the declines we find Minor a of Int. A was a simple 7 waves, and Minor a of Int. C was also a simple 7 waves. Minor c of Int C, however, has recently extended to 13 waves. This is an incomplete corrective wave and needs at least one more small rally and decline. The SPX 1285-1289 area would fit quite nicely for a low.
From a fibonacci perspective SPX 1291 represents a 50% retracement of the entire uptrend from1159-1422. The next retracement support would be the 61.8% level or SPX 1259. Both of these levels are at the support pivots: 1291 and 1261. Heading into next week, if the OEW 1291 pivot range, (SPX 1284-1298), does not hold the market is likely heading toward the 61.8% retracement level at the 1261 pivot range. Best to your trading!
FOREIGN MARKETS
The Asian markets were all lower on the week losing 4.0%. Only China, of the 8 indices we track, remains in an uptrend.
The European markets were also all lower on the week losing 5.0%. All 7 indices we track are in downtrends.
The Commodity equity group all fell as well losing 7.8% on the week. All 3 indices we track are in downtrends.
The DJ World index continues to downtrend and lost 5.4% on the week.
COMMODITIES
Bonds continue to uptrend, gaining 0.6%, as the 10yr Bond made a new all time high. Ten year yields are near all time lows of 1.696%. The 30yr is approaching 2011 levels 2.694%.
Crude continues to downtrend, losing 4.4% on the week. The recent market action here looks quite similar to the spring of 2009, 2010, and 2011. Those declines were 21%, 23% and 34% respectively as noted on the weekly chart, page 9. The current decline is 18%.
Gold had a wild week. After being down over $50 it rallied to end the week with a 0.6% gain. The downtrend may have bottomed at wednesday's $1527 low, after hitting its most oversold medium and long term level since 2008.
The USD continues to uptrend gaining 1.3% on the week. The downtrending EUR lost 1.1%, while the uptrending JPY gained 1.2%.
NEXT WEEK
A light calendar ahead, economically, kicks off on tuesday with Existing home sales. On wednesday New home sales and the FHFA housing index will be reported. Thursday weekly Jobless claims and Durable goods orders. Then on friday Consumer sentiment. The FED has nothing scheduled ahead of the Memorial day holiday next monday. Best to your weekend and week!
Friday, May 11, 2012
Bond bubble alive & well - what to get ready for in US Treasuries
My own charts are below, but first look at today's free chart analysis by Tom McClellan, "Is JPM "The Burning LOH"? - Free Weekly Technical Analysis Chart - McClellan Financial" at http://www.mcoscillator.com/learning_center/weekly_chart/is_jpm_the_burning_loh/. Tom McClellan had said a few weeks ago that US bonds would rally again. He was right on that, and now he's suggesting we may be getting near a peak. I don't think he has a specific price target, however. Read his article to understand what he's saying about his chart:

He points out that bonds often peak at crisis times. So it might not be just the Federal Reserve purchases and "Operation Twist". Yet it's interesting that the Fed currently plans to discontinue that level of purchases. Another reason why US bond prices could correct AFTER hitting peak price targets. (So after there's a trend reversal confirmed, KI$$ investors can sell TLT and buy TBT if that looks appropriate for their strategies.)
Can I guarantee the $150 Fibonacci and P&F price target? Of course not a guarantee - but the rally has strength. It's even possible the price may overshoot $150, so that's why investors and traders should look for a reversal pattern in any event.
The Fibonacci projection to $150 is also supported by point & figure projections, and by the indicators which continue to be supportive. As I mentioned, I'm glad to see Tom McClellan addressed this because it dovetails with the bullish projection I've been pointing out for weeks (even months). Here are my basic charts (from Stockcharts.com) for $USB the US long-term bonds. First the daily, then the monthly. Notice there's just a hint of negative divergence that will be important if it persists as $USB pikes new highs. But the monthly StochRSI did a bullish midline retest as price pulled back - that supports the likelihood that the US long-term Treasury bonds should continue to new highs and meet the $150 projection.
And finally here's the default point & figure chart for $USB from Stockcharts.com. Notice that it never did break support and still sports a bullish projection to $150:
Wednesday, May 2, 2012
It's a gas! Natural gas trend reversal not just blowing bubbles
Technical indicators like Stochastics-Relative Strength Indicator (StochRSI) and MACD are part of the confirmation, supporting the Elliott Wave counting. I can't speak for Tony's projections, but I see a potential for $NATGAS (spot) to head for the monthly Bollinger Band midline which may converge with retesting a broken trendline on my monthly chart at approximately $3.80 (double its recent low), then pull back to perhaps $2.85 (which would be a 50% retrace) before pushing up toward testing $6 to $7 eventually. By the way, when I tweet about natural gas prices short-term, I refer to the /NG futures because that what I'm seeing on my trading charts, so allow for the difference between futures and spot pricing. (An ETF like UNG or BOIL will generally track but not necessarily exactly so be aware of that too.)
You can find Tony Caldaro's charts link at the bottom of each of his updates to view these along with all of his public charts. You can find his daily market updates via his tweets as @OEWtony on Twitter, or going to his OEW website http://caldaro.wordpress.com/, or right here in the OEW feed at lower right side of the full site page.
Here's his weekly chart:
And here's my monthly chart of $NATGAS. The markings are outdated but I think the broken shallow uptrending line may serve anew as a place for price to retest probably when it also tests the monthly Bollinger Band midline.