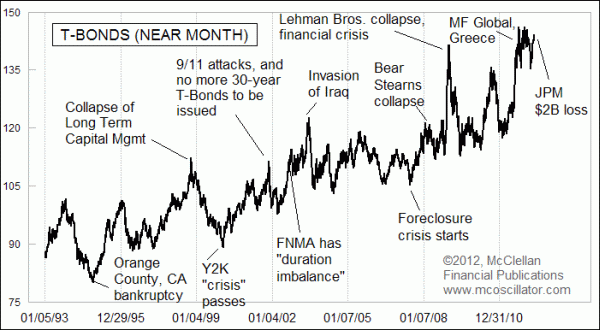
My own charts are below, but first look at today's free chart analysis by Tom McClellan, "Is JPM "The Burning LOH"? - Free Weekly Technical Analysis Chart - McClellan Financial" at http://www.mcoscillator.com/learning_center/weekly_chart/is_jpm_the_burning_loh/. Tom McClellan had said a few weeks ago that US bonds would rally again. He was right on that, and now he's suggesting we may be getting near a peak. I don't think he has a specific price target, however. Read his article to understand what he's saying about his chart:

He points out that bonds often peak at crisis times. So it might not be just the Federal Reserve purchases and "Operation Twist". Yet it's interesting that the Fed currently plans to discontinue that level of purchases. Another reason why US bond prices could correct AFTER hitting peak price targets. (So after there's a trend reversal confirmed, KI$$ investors can sell TLT and buy TBT if that looks appropriate for their strategies.)
Can I guarantee the $150 Fibonacci and P&F price target? Of course not a guarantee - but the rally has strength. It's even possible the price may overshoot $150, so that's why investors and traders should look for a reversal pattern in any event.
The Fibonacci projection to $150 is also supported by point & figure projections, and by the indicators which continue to be supportive. As I mentioned, I'm glad to see Tom McClellan addressed this because it dovetails with the bullish projection I've been pointing out for weeks (even months). Here are my basic charts (from Stockcharts.com) for $USB the US long-term bonds. First the daily, then the monthly. Notice there's just a hint of negative divergence that will be important if it persists as $USB pikes new highs. But the monthly StochRSI did a bullish midline retest as price pulled back - that supports the likelihood that the US long-term Treasury bonds should continue to new highs and meet the $150 projection.
And finally here's the default point & figure chart for $USB from Stockcharts.com. Notice that it never did break support and still sports a bullish projection to $150:


No comments:
Post a Comment