Andre has been adding a gold chart analysis from time to time, and this report has an update on that too. A very valuable addition for anyone who tracks or trades gold or other precious metals - and it's very interesting as a market-awareness item for all investors and traders too! Without further ado, here's what you need to know now:
=============
June 27, 2010
Week-end Report
Turning Points
By Andre Gratian
Long Term trend: Up from March 2009
Intermediate term trend: (unconfirmed) Down from April 26, 2010.
After a brief upside correction, the downtrend from 1220 has resumed. Last week, the bottoming 17-wk cycle combined with a Bradley date on 6/26 probably created a near-term low which could see a bounce back up to 1095-1100, but the downward pressure from the 2-yr cycle which is coming into its low should continue until the early part of July.
It is unclear if the 1040 level will be broken by the bottoming 2-yr cycle. Following the cycle low, another, longer corrective rally should develop, and after it has exhausted itself, the trend should continue down into the 4-yr cycle low in the Fall.
This is the anticipated scenario which we will monitor until the end of the year, but for the moment, let’s focus on the low which was most likely created last Friday, and see how far it takes us. We’ll start analyzing the SPX with its Daily Chart.

The index ostensibly gave an intermediate sell signal when it broke out of its (blue) intermediate channel from the 2009 low. Technically, this will remain unconfirmed until it trades decisively below the 1040 level.
However, with the MACD and the A/D indicator going below their comparative lows on 5/17, this is only a formality.
On 6/21, the corrective rally came up against the dotted resistance line and turned down into what is now an unconfirmed short-term downtrend. It, too, would have to break below the 1040 level to be perceived as more than just a part of the consolidation pattern which started on 5/25. Two factors suggest that it may do so. The first is that the same dotted resistance line which created the 1220 top and stopped the corrective rally is also likely to stop the bounce from the 17-wk cycle low. As for the second, the 2-yr cycle low which is estimated to come about 7/12, is still far enough away to allow a decline below 1040 into that time frame.
Whether or not the 1040 level is taken out during this decline is of no consequence to the longer term trend, and 1220 is likely to remain the high for the rest of the year.
The decline from the 6/21 interim top of 1131 into the 17-wk cycle low most likely ended last Friday at the 1068-70 P&F projection. The actual low was 1067.89. From that point on, the SPX rallied with the support of some of the best A/D numbers since 6/18, and even though it did not close on the high of the day, the moderate pull-back into the close -- and the 6/26 Bradley date -- reflected little weakness. This suggests that the rally will continue on Monday. To examine the making of the low more closely, let’s analyze the Hourly Chart.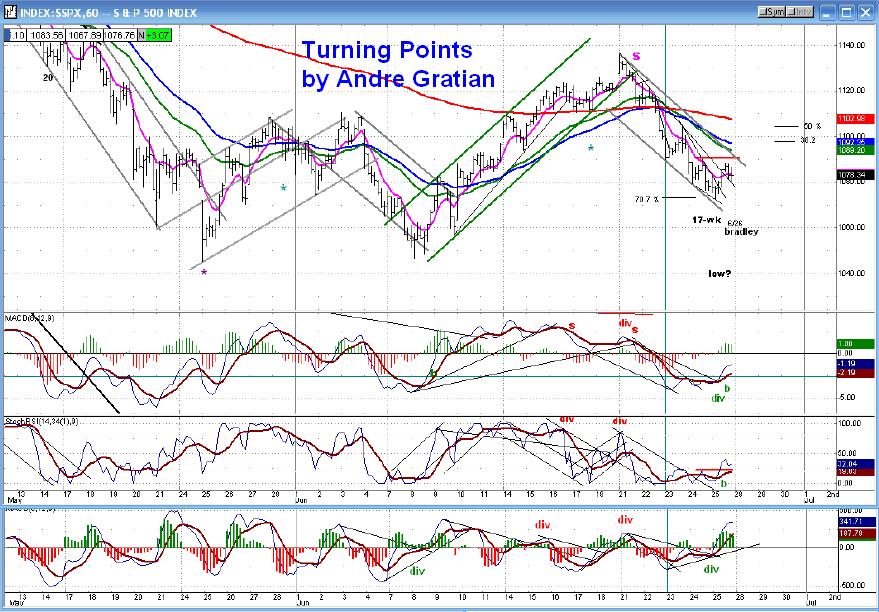
The negative divergence that marked the 1131 top was apparent on the momentum indicators. Less so on the A/D. When the index broke out of the green channel and, subsequently, below the MAs, it was a sign that it intended to go lower.
The first attempt to hold came at a 50% retracement. The next, at the .618 level. But it had to drop all the way to about 71% of its former rally before finding a low. That’s probably too much of a pull-back to suggest that this is only a correction of the former advance. That it might be something more is substantiated by the daily indicators which have given sell signals and show no sign of reversing.
Furthermore, the 2-year cycle low is still ahead of us and should continue to pressure the market for the next couple of weeks. All these factors intimate that only a minimal bounce should be expected, perhaps up to the levels indicated on the chart. After that, the decline should resume into the larger cycle low.
I will not be able to give an accurate projection for the final low of the short-term downtrend until we have completed the interim pull-back.
What follows the bottoming of the 2-year cycle should be a better rally, possibly into late August and I’ll provide a forecast about how far it should go at the appropriate time.
Gold
After reaching its 122 P&F projection and a subsequent short consolidation, GLD is trying to make it to the higher potential target of 128. The negative divergence showing in the indicators, and the low volume behind the last try at making new highs suggest that it will either need additional consolidation before moving higher, or give up its attempt completely. The next few weeks should decide: it may move out of the green channel, but as long as it remains in the black channel, it may yet succeed.
Andre


No comments:
Post a Comment