 Today's huge gains in the stock market seemed very impressive, and not the least because they weren't expected! We had been thinking that the level of 1042 $SPX (S&P 500 index) would be the "lid" on the market and instead, the market tested it this morning then turned that resistance into support. Once that occurred there was no place to go but UP UP UP! Tacking on another 20 SPX points which, let's face it, is a handsome gain intraday even on top of the big move up to 1042 SPX in the first place this morning. So what's it mean?
To answer that I'll start with the SPY (S&P 500 ETF) hourly and daily charts, at right and below. You can see that the move, while wide-ranging in the amount of movement, was not on heavy volume until the last hour when I'm sure many shorts were throwing in the towel as SPX 1042 looked like a shelf of support. But on the other hand, the most that can really be said is that price tested back to exponential moving averages (EMA's) on the daily chart (below), and a return to the level of the opening hour June 29 when price gapped down badly that day. The BIG test therefore becomes whether price can continue upward to move up through that gap, or will it fall down again. Students of gaps often refer to break-away gaps (an initial move), testing gaps (where price re-tests back to the gap level), and exhaustion gaps (where the move after the gap finishes a major wave or cycle and then price moves back through the gap in a trend reversal). We cannot know until tomorrow whether price will continue upward through the gap on the hourly chart - if it does, that will be a sign of strength, even though the 200-hour MA awaits somewhat higher and can provide some resistance of its own.
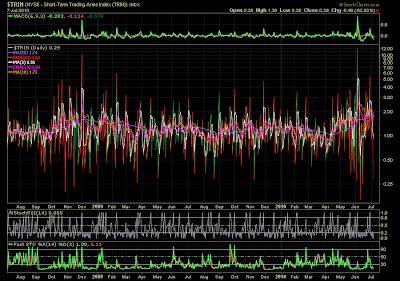
But the EMAs on the daily chart will be an immediate area of resistance too. Furthermore, look at the technical indicator charts also below - the NYMO, NYAD and TRIN. These all show that the stock market had become quite oversold - therefore, it's quite possible that all we've seen so far is an oversold bounce. The technical charts aren't confirming at this point, that there's enough strength to call this a trend reversal. For example, the Summation Index portion of the NYMO chart still shows the market in a weak place. The OBV (on balance volume) indicator on the SPY daily chart is still below its own 30-day moving average. And the TRIN shows today's value and the short-term moving average at levels that can be consistent with weakness ahead, even though the longer-term moving averages remain at the oversold areas.
Price resistance from the June 25 lows also sits just above where the stock market closed today, providing yet another reason to refrain from calling this anything other than a tremendous bounce move. If there is follow-through in terms of price moving above these resistance levels with confirmation from the technical indicators, then we can put more faith in the short-term bull case. Unless and until that happens, however, I hope my readers won't mind if I remain a skeptic. Yes, that means I'm still considering the case for the SPX to test down to 1000 and possibly even 970 before the down-move is completed - we cannot rule that out yet.


No comments:
Post a Comment