Operation Twist is a "POMO" discussed in this week's free chart analysis by Tom McClellan at http://www.mcoscillator.com/learning_center/weekly_chart/. Given that 4.3 months (half of 8.6) from October 4, 2011 lands somewhere about now - mid-February - it'll be interesting to see how the market behaves from here. Well - I won't speculate too much on that right now. But at least, here's a quote from McClellan's article, which my readers should find interesting:
=============
February 17, 2012
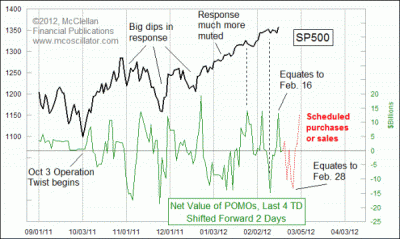
Fed Sloshing The Liquidity Pool
The Fed's Permanent Open Market Operations (POMOs) have a bigger effect on pushing stock prices up and down than most people would like to believe. The financial media like to convince us that what moves the market up and down are earnings news, employment reports, or concerns about Greek debt. But this week's charts reveal that the Fed's thumb on the scale has a big effect. The New York Federal Reserve Bank is the agency conducting these POMOs on behalf of the Federal Reserve, and the NY Fed kindly publishes a lot of data about them. They even give us a… more


No comments:
Post a Comment