=============
April 22, 2012
Market Turning Points
Week-end Report
By Andre Gratian
Precision timing for all time frames through a 3-dimensional approach to technical analysis: Cycles - Breadth - P&F and Fibonacci price projections, and occasional Elliott Wave analysis
“By the Law of Periodical Repetition, everything which has happened once must happen again, and again, and again -- and not capriciously, but at regular periods, and each thing in its own period, not another’s, and each obeying its own law … The same Nature which delights in periodical repetition in the sky is the Nature which orders the affairs of the earth. Let us not underrate the value of that hint." -- Mark TwainCurrent position of the market
SPX: Very Long-term trend – The very-long-term cycles are down and, if they make their lows when expected (after this bull market is over) there will be another steep and prolonged decline into late 2014. It is probable, however, that the steep correction of 2007-2009 will have curtailed the full downward pressure potential of the 120-yr cycle.
SPX: Intermediate trend – The intermediate uptrend is still intact, but a short-term top is already in place.
Analysis of the short-term trend is done on a daily basis with the help of hourly charts. It is an important adjunct to the analysis of daily and weekly charts which discusses the course of longer market trends.
Daily market analysis of the short term trend is reserved for subscribers. If you would like to sign up for a FREE 4-week trial period of daily comments, please let me know at ajg@cybertrails.com.
Market Overview
Important correction to the newsletter:The SPX remains in an unconfirmed short-term decline. It will be confirmed when it trades lower than the recent 1357 low. Until it does, there is a possibility that the index is making a consolidation pattern in preparation for continuing its bullish uptrend.
The SPX remains in an unconfirmed short-term decline. It will be confirmed when it trades lower than the recent 1357 low. Until it does, there is a possibility that the index is making a consolidation pattern in preparation for continuing its bullish uptrend.
I rate the odds of that possibility as very low. On the Point & Figure chart, the trading pattern which resulted in a high of 1422 is clearly a distribution phase which stands unresolved in spite of the drop to 1357. In order to fully unleash the potential that was built up during these 4 weeks of distribution, the SPX would have to drop to 1342 at a bare minimum, most likely to about 1300, and perhaps to as low as 1245. The stock market moves forward in a continual process of accumulation-uptrend, distribution-downtrend. Each period of accumulation and distribution stores energy which is released in the following move. This happens in all time frames and is one of the basic structural mechanisms by which the stock market progresses.
I rate the odds of that possibility as very low. On the Point & Figure chart, the trading pattern which resulted in a high of 1422 is clearly a distribution phase which stands unresolved in spite of the drop to 1157. In order to fully unleash the potential that was built up during these 4 weeks of distribution, the SPX would have to drop to 1342 at a bare minimum, most likely to about 1300, and perhaps to as low as 1345. The stock market moves forward in a continual process of accumulation-uptrend, distribution-downtrend. Each period of accumulation and distribution stores energy which is released in the following move. This happens in all time frames and is one of the basic structural mechanisms by which the stock market progresses.
When the SPX dropped below 1393, it broke below a support level that has now become a strong resistance area, and which it has tried unsuccessfully to overcome for the past two weeks. During this time, the index has constructed what appears to be another phase of distribution which closely resembles the one formed at the higher level, and it looks nearly complete. If that’s the case, the decline which started from 1422 is about to resume. The next few days of trading should be decisive.
There is an important cycle bottoming at the end of the month which should play an important role in the near-term market action as it applies more and more downward pressure with each passing day. Since the beginning of the bull market in 2009, like clock-work it has brought about a significant decline in the stock market when making its low. It would be more logical to expect a recurrence of that pattern than to ignore it. Its last bottom came in early October of last year in conjunction with the 3-yr cycle, and it is again due at the end of April.
If the current market activity is being interpreted correctly as a corrective pattern which is almost complete, the resumption of the decline should occur during the coming week.
Chart analysis
We’ll start with the Daily Chart of the SPX. Let’s first look at the structure. From the 1159 low in November of last year, the index progressed to 1422 in what appears to be 5 waves before breaking its trend line in early April. This caused a decline to 1357 and to the bottom of the rising channel in which it is still confined. Until it comes out of that channel on the downside, the SPX is still in an uptrend.
Instead of rebounding smartly, as it did the last time that it touched its trend line before breaking it, the price activity for the past two weeks has consisted of crawling along the bottom channel line. This is not a strong pattern! This crawling action, more often than not, results in a break of the trend line which is acting as support, and in a continuation of the downtrend.

In this case, with an important cycle exerting increasing pressure on prices every day, it’s almost a foregone conclusion that the next move will be on the downside.
The indicators suggest this as well. The MACD is still declining and the two lines continue to be apart. This is reflected in the histogram which continues to be negative and is having difficulty making upward progress. The SRSI is having the same problem and, on the above chart, the price continues to remain under the declining 21-DMA.
Time is getting short. The SPX must soon make a decision about moving decisively up and above its overhead supply, or down, outside of its channel lines. If the cycle due to make its low at the end of the month has anything to say about it, the direction will be down.
On the Hourly Chart, the overhead resistance is clearly marked, encompassing everything which extends above the red trend line. The SPX has made two weak attempts at moving through it, both of which have failed. The second was a little more successful in that it actually made it to the line but, in order to resume its uptrend, the index would have to show that it can convince enough buyers to push it through the resistance decisively. That does not seem likely. As in the higher pattern, the third attempt is usually the last one and we seem to have already started it. Time-wise, the last two moves upward took two days each. The current move is already a day old! If it follows the same time schedule as the previous two, the final attempt should end on Monday or Tuesday of next week.
The above is speculation that the future will resemble the past. If it does not, we’ll have to revise our expectations.

Cycles
The only cycle that really counts at this time is a 29-30-wk cycle which has produced regular phases for the past three years. If it continues to do so, we can expect a market decline into the end of the month and, if this takes place, we can also expect a good bounce afterward. Of course, this time it will not be reinforced by the 3-yr cycle which bottomed exactly at its previous low, so we should not look for anything as dramatic as the uptrend which started on October 4. But there should be a decent rally nevertheless, especially if the decline reaches one of the projection levels mentioned above.
Breadth
Amazingly, the NYSE Summation Index (courtesy of StockCharts.com) continues its uninterrupted decline and has now retraced just above zero. This corresponds to the level where we started the uptrend from 1159 on the SPX and it is surely a sign of internal market weakness.
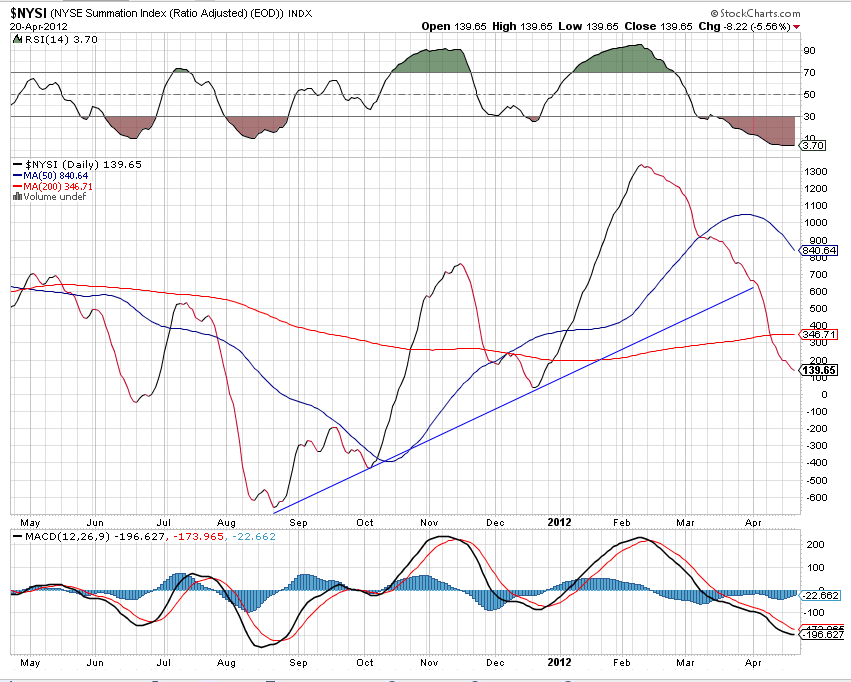
When we look at the NYSE McClellan oscillator (below) we can see why the NYSI continues its downtrend. The NYMO has been predominantly negative since mid-February. Another example of the current degree of internal weakness is the position of the 50-DMA. When the rally started in October of last year, it moved above the 200-DMA and stayed above it until recently when it crossed below and is still dropping. Does this mean that the market will remain in a declining mode until it crosses back above, again?

Sentiment
The SentimenTrader is not revealing anything important at this time, so we’ll put it on the back burner until it does.
VIX
The VIX broke its downtrend line at the same time that the SPX broke its uptrend line, thus providing the confirmation that this was a legitimate reversal. That was different from the brief correction which happened the second week in March, when the VIX went up for two days and immediately reversed before overcoming any recent top. This time, the move was preceded by some positive divergence which occurred when the VIX stopped making new lows while the SPX continued to make new highs.
The VIX made a near-term high when the SPX dropped to 1157 and it has been drifting down ever since, making essentially the same pattern in reverse that the SPX is making – that is, until Friday, when the VIX made a slightly new low while the SPX did not overcome its former high. That’s negative divergence! It’s too soon to tell if it is anything important, but I will be keeping a close eye on it for the next few days. If the VIX continues to drop lower, it could mean that the SPX is ready to surprise us on the upside. Friday was option expiration day and during that period, trading patterns can be slightly distorted. This may have caused an aberration in the VIX.

XLF (Financial SPDR)
The XLF looks like the SPX – and should! It’s value lies in diverging from the SPX. This happened briefly when it failed to make a new high along with the SPX on the third top of the ending diagonal. This slight negative divergence turned out to be an important warning: the SPX was about to reverse! It may be sending the same message again. Friday’s action was slightly more negative than that of the SPX. It is showing the same crawling pattern as the SPX at the bottom of the channel, with the same implication. Weakness in the indicators is another factor.
If the SPX breaks out of its channel on the downside, we want to make sure that the move is validated by corresponding action in the XLF.

BONDS
There has been little change in TLT over the past week. It continues to press up against the support line that it broke in mid-March. The fact that it is not selling off means that it probably intends to break through on the upside. If it does that, the SPX will probably go in the opposite direction.
The indicators tell the same story. Both the MACD and SRSI are in strong uptrends, and the histogram is showing more strength than it has in the past six months, and does not want to relinquish it. The whole picture is bullish for the bonds and bearish for stocks.

UUP (Dollar ETF) Daily Chart
UUP continues to struggle with trying to maintain a basic uptrend since its November 2011 low. There is not much weakness; only a sideways move in the form of a large pennant which should eventually be resolved on the upside. It is currently testing a parallel to the bottom trend line which has provided support on several occasions.

It looks as if the last cycle inverted and that could mean several more days of downside pressure. This is also what is suggested by the indicators which recently turned down.
GLD (ETF for gold)
On this weekly chart, GLD is looking more and more precarious. It has now gone sideways for 5 weeks, and the last two weeks look as if they are beginning to turn down. The indicators don’t look so hot, either. After a brief interruption, the MACD has continued its downtrend and made a new low, preparing to go negative for the first time in three and a half years. (The “0” line for the MACD is the dashed line.)
Considering the fact that a dominant cycle is bottoming in a few weeks, it is likely that GLD won’t be able to reverse its downtrend until after that cycle has made its low.

OIL (USO)
The weekly trend of USO has also turned down. After hitting a double-dose of resistance -- one from back-testing a former long-term trend line, and the other from a band of resistance caused by former tops -- USO has been in a downtrend for nine weeks and does not look ready to reverse. After showing some negative divergence at the top, the histogram has just gone negative, meaning that the MACD lines have just started to cross to the downside.
The index is weighing heavily on the 21-wk MA. If it does not break though the established downtrend line soon, it will fall below its MA and make the picture even more negative. That’s the bad news! The good news is that, with the price of oil falling, gasoline prices should retrace their recent advance.

Summary
Time is running short for the SPX to make an attempt at recovering its uptrend. It may even have run out! Pressing more and more on prices every day is a cycle which is due to bottom at the end of the month.
Structurally, the index appears to be making a pattern which is a smaller replica of the one at the top, and it appears to be - literally - on its last leg!
Andre
FREE TRIAL SUBSCRIPTON
If precision in market timing for all time frames is something that you find important, you should consider taking a trial subscription to my service. It is free, and you will have four weeks to evaluate its worth. It embodies many years of research with the eventual goal of understanding as perfectly as possible how the market functions. I believe that I have achieved this goal.
For a FREE 4-week trial, Send an email to: ajg@cybertrails.com.
For further subscription options, payment plans, and for important general information, I encourage you to visit my website at www.marketurningpoints.com. It contains summaries of my background, my investment and trading strategies, and my unique method of intra-day communication with subscribers. I have also started an archive of former newsletters so that you can not only evaluate past performance, but also be aware of the increasing accuracy of forecasts.
The above comments about the financial markets are based purely on what I consider to be sound technical analysis principles. They represent my own opinion and are not meant to be construed as trading or investment advice, but are offered as an analytical point of view which might be of interest to those who follow stock market cycles and technical analysis.


No comments:
Post a Comment