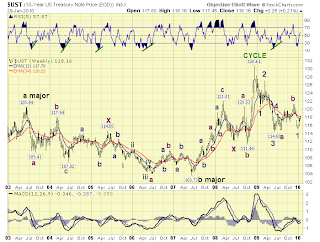
Got TBT? U.S. Treasury bonds and 10-year notes are poised to make a very big move down, very soon, judging by the charts. Below I've posted a daily and then monthly chart of the bonds, $USB. Next are Tony Caldaro's daily and weekly charts of the 10-year notes $UST (from his public charts site, see his Elliott Wave Lives On site in the sites list at right - thanks again Tony!). The primary idea is that, after completing a gap fill and running into resistance such as the 34-week exponential moving average (EMA) and 200-day MA, these longer-term Treasuries are about to finish a wave 2 up. That will be followed in short order by a wave 3 down. The wave 3 down should be deeper than the recent wave 1 marked on Tony's chart, and mark new lows as it drops under the multi-month consolidation range.
Notice that recent wave 1 down on Tony's chart had some price gaps. Since gaps are more common in third waves (and C waves), and that wave 1 down had gaps (in its "wave 3 of 1"), then we should expect some serious gaps down during the wave 3 down (especially in its "wave 3 of 3"). So it's time to position for a significant trend change to persistent downtrending in these longer-term Treasuries.
This view will be negated if these Treasuries make new range highs above their end-of-November highs. So to keep it simple (KI$$), I'm thinking scaling into TBT starting Monday (and/or put options on TLT, and other traders may have other methods). With the initial stop at the end-November highs - which can be brought closer to just above the "wave 2" lower high once an expected trend reversal pattern manifests.
If Treasuries were to go above their end-November highs, I'd be thinking a bigger "abc" consolidation (maybe with its own b-wave triangle) that would be likely to break to the downside when complete. That isn't my primary scenario because I think a wave 3 down should start very soon; but, we'll keep it on the back burner just in case.
For price targets - one point to remember is that wave 3 is often 1.618 the length of wave 1 - not always, but often. It wouldn't surprise me if it takes Treasuries to a long-term trendline, which might contribute to a wave 4 consolidation before wave 5 of c breaks underneath that. Also, notice Tony's count is for a "wave c" and that could reasonably be at least equal to "wave a" by the time it completes. Then too - many are likely to see this as a large "head and shoulders" pattern, having a measured move target equal to the "head" from the "neckline" once the neckline - at $114 in the 10-year note, $UST - once it breaks under that neckline. From the 18-year cycle top about $130 to $114 is a difference of $16, so if the measured move target works, that would imply a target price about $98 in $UST. The drop we're expecting now should be sharp and swift (as a wave 3), but getting to $98 should take a bit longer because of the time scale.
Ultimately, Treasuries should go lower yet in a series of cyclic waves, because the big-cycle high appears to gave been completed in late 2008. If the 10-year note ($UST) exceeds about $125 that could postpone this huge turn. But it's looking more likely that the big turn is underway, and this next sharp move down should start as early as Monday, February 1. It doesn't necessarily imply what happens in equities, etc., because some of the long-standing financial asset correlations are also subject to change. Because the fundamentals aren't necessarily about "riskier" assets becoming more favored. It's also about U.S. Treasuries themselves becoming perceived as more risky than they used to be - that's a paradigm shift.
Subscribe to:
Post Comments (Atom)


No comments:
Post a Comment