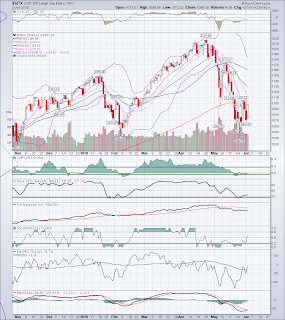
There certainly are great swing-view analysts who've presented their stock market views covered here, so I'm not intending to do anything other than point out with my own charts the predicament the market is in. You can see on the daily chart below that the current effort is testing the 200-day moving average in the S&P 500 index ($SPX), simultaneously with a similar test that's ongoing with the Dow Jobes Industrial Average. My weekly chart also shows that the market is in the area between the weekly lower Bollinger Band and that indicator band's midline (currently sitting about the 1130 area). So there's resistance at the current level being tested around 1103, as well as a Fibonacci level around 1120, plus that 1130 area if it gets that far.
The indicators reflect the effort to bounce from oversold. Yet there's also enough weakness that there's no guarantee of higher highs into the August time frame as we'd once hoped at the beginning of the year. Yes, I know that Tony Caldaro and maybe others are seeing this as a bull market pullback, so we can defer any debate on bull versus bear and just note the technical backdrop doesn't guarantee higher highs. If you're following Terry Laundry's T Theory, which I like to keep up with, you know that he's warning of a bearish "T" with a lower high into the August 26 time frame. Meantime, if the market can't make 1103 support, then we're likely to revisit 1090, maybe 1060, and possibly even 950-ish before the end of June.


No comments:
Post a Comment