=============
June 26, 2011
Market Turning Points
Week-end Report
By Andre Gratian
Precision timing for all time frames through a 3-dimensional approach to technical analysis:
Cycles - Breadth - P&F and Fibonacci price projections
“By the Law of Periodical Repetition, everything which has happened once must happen again, and again, and again -- and not capriciously, but at regular periods, and each thing in its own period, not another’s, and each obeying its own law … The same Nature which delights in periodical repetition in the sky is the Nature which orders the affairs of the earth. Let us not underrate the value of that hint." -- Mark Twain
Current position of the market
Very Long-term trend – The very-long-term cycles are down and, if they make their lows when expected, there will be another steep and prolonged decline into 2014-16.
Long-term trend - In March 2009, the SPX began a move which has evolved into a bull market. Cycles point to a continuation of this trend for several more months.
SPX: Intermediate trend – From a time perspective, the correction which started at 1370 is probably close to deserving an intermediate label. Although it has only brought about a decline of 112 points (8%), it is entering its 9thth week. Next week could be pivotal in determining if the correction has ended.
Analysis of the short-term trend is done on a daily basis with the help of hourly charts. It is an important adjunct to the analysis of daily and weekly charts which discusses the course of longer market trends.
Daily market analysis of the short term trend is reserved for subscribers. If you would like to sign up for a FREE 4-week trial period of daily comments, please let me know at ajg@cybertrails.com.
Market Overview
Even though the SPX closed 3 points lower than the previous week, it was the first time since the correction started at 1370 that the SPX and other equity indices did not make weekly lows, and this could be significant. Even the XLF, the weakest of them all, held its ground! However, it will take another week or two to determine if SPX can hold above a low of 1258 and start reversing its downtrend.
As we will see, the odds that it will are fairly decent. The stock market has a history of correcting into late June or early July. In the past two weeks, a nest of cycles – including Martin Armstrong’s 8.6-yr economic cycle -- made lows, and the next cycle which could affect the market is not due until the middle of July. This should give the market an opportunity to start an uptrend so that it doesn’t get shoved down to a new low by the bottoming 9-mo cycle.
Our “White Knight” (the SentimenTrader) is still giving strongly positive readings. In addition, two other indicators that were giving us concern, the Summation Index and the “Black Knight” (NDX:SPX), appear to have bottomed and have started to turn up. Also, the SPX and QQQ may both have started a pattern of higher highs and higher lows. If they prevail and starts to gain some upside momentum, it would be a strong signal that a reversal is taking place.
Chart Analysis
Let’s start by looking at the SPX over three time frames: weekly, daily, and hourly. With a quick glance at the Weekly Chart, we can assume that the long-term trend is still up, but that either a correction or a reversal of the trend is taking place. The chart has some positives: although it broke an intermediate trend line, the price is still trading above the major trend line from the 2009 lows. Another positive is that the MACD, although declining, is still above the zero line. The lower indicator is oversold, but that is only a minor plus because it has not yet turned up. Finally, last week the index made a higher high as well as a higher low. These observations lead us to conclude that, for the moment, this index is more likely to be undergoing a correction in an uptrend than making a long-term reversal. If this activity were taking place outside of the longer trend line, we would have a reason to believe that the latter might be the case.
Let’s now move to the Daily Chart to see if there is any evidence that the correction is coming to an end; we find some, but it is not conclusive. The index is still trading within the limits of its corrective channels. It will have to move outside the blue channel (the steepest of the two) and must overcome the wider gray one as well to confirm a reversal. The true downtrend line of the correction is the top line of the gray channel. In both channels the dashed line is the channel median. Last week, the SPX made an attempt to start a reversal by moving into the upper half of both channels, but it quickly ended in failure with the price closing the week in the lower halves. Nevertheless, this action started an up-move in the indicators and, although they are now correcting, they remain in an uptrend and show some positive divergence with the MACD histogram remaining positive.


The least positive thing we can say about the overall picture is that last week’s activity represents a deceleration of the downtrend, which is normally a precursor to its reversal.
Reversals are easier to pin-point on an Hourly Chart. Technically, we could say that an uptrend may have started in the SPX. The index has now made a higher high and a higher low, with the budding uptrend outlined in black trend lines. In order for this to be confirmed, we will need to see the index develop some upside momentum by breaking through the top of the small black channel and trading above 1300. This may not be so easy to do. That level will prove to be tough resistance with a combination of a former top, the 200-hr MA, and the top of the blue channel all pushing back. But an attempt must be made, and this is why it is important for the bulls that Monday’s opening be positive. Friday’s action in the SPX was encouraging with the indicators giving a promising (but still fragile) technical picture. Even through Friday was a very negative day, the selling seemed to subside by day’s end. It was much less positive (if not outright negative) in the QQQ, where the price indicators ended the day showing negative divergence, although this was not reflected in the A/D oscillator.
The most important factor which could set the tone on Monday is how the dollar opens! If it is up, the indices stand a good chance of breaking through the bottoms of their black channels, and perhaps even making new lows. Neither index has fully reached the exact targets determined by their Point & Figure counts. The SPX could still drop to about 1250, and the QQQ still reach 53 and perhaps even lower. There are several valid counts and they have not all been met. This is why the positives that have accrued over the past two weeks could all be erased early next week.
Let’s continue our analysis by taking a closer look at the Hourly Charts of the SPX and the QQQ this time with the A/D indicators included.

The QQQ made a fractional new high of 7 cents last Thursday to establish its (perhaps dubious) higher-high, higher-low pattern. Its up-channel is at a steeper angle than the SPX’s, but what really matters is that it should not trade below Thursday’s low of 54.06 -- even if it does break its trend line by a small margin. The top two indicators have spoiled what could have been a bullish set-up, but they still could be offset by the bottom (A/D) oscillator which did not reflect the weakness showing in the others. Of the two, the SPX is the stronger, but if the QQQ starts weak on Monday, it will undoubtedly pull the SPX along. We need to wait until Monday to see what the market decides to do at the opening, and take it from there.
Cycles
Of the several cycles that were supposed to bottom in the past two weeks, the 17-wk cycle was to be the last. It looked as if it had made its low a few days early on 6/23, and that this had resulted in a successful test of the low. However, with the condition of the QQQ indicators at the end of the week, this is no longer certain, and the cycle low could turn out to be Monday or Tuesday -- closer to its ideal time slot.
The 9-mo cycle is due in the middle of next month. If the market is already in an established uptrend by then, it should not have much of an effect.
Breadth
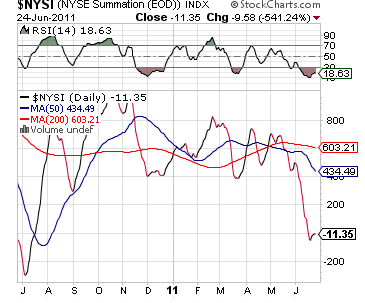
Last week, the pattern of the NYSE Summation Index (courtesy of StockCharts.com) moved up from a deeper negative, along with the RSI which is still very oversold. This is an indication that the trend may be starting to reverse. We’ll need more evidence, but it’s the first up-tick since May 25, and it could be the start of a positive trend.
Sentiment
Although the SentimenTrader (courtesy of same and referred to as the bulls’ “White Knight” last week) remains bullish, it was a little more so earlier. I don’t know if this has any near-term significance.


The indicator next to it shows the relative strength of the NDX to the SPX (the “Black Knight”). When the NDX (or QQQ) leads, it is normally the sign of a strong market. When it lags, the opposite appears to be true. Until last week, the NDX had been lagging, confirming the downtrend. Last week it got back in sync with the SPX. Another small albeit inconclusive, positive.
When the market made its low, the VIX finally rose to about 25, but pulled back immediately to about 18, closing the week at 21.10. It is still in a short-term uptrend and has not given a conclusive sell signal. Just like the other indicators, it does not seem to be absolutely sure that we have seen the low of the decline.
Like the QQQ, the RUSSELL 2000 is considered to be a leading indicator and, right now, it looks like it’s doing its job. Although this index is still in a downtrend, its charts show more strength than those of the SPX and of the QQQ.

As it is with the SPX, the weekly chart also has the look of an index which is probably in a long-term uptrend consolidation with the indicators showing even more clearly that the correction may have run its course. The histogram of the MACD had its first up-tick last week, with the lines above it beginning to curl upward. The lower indicator, which was oversold, has begun to lift off the bottom.
The daily chart is also more positive than its equity counterparts. The MACD can be said to have given a preliminary buy signal, and the lower indicator (MSO) has turned positive. The price pattern sure looks like the beginning of an uptrend. Of course, this won’t be confirmed until RUT starts to trade outside of both channels. Until it does, and in spite of its good looks, this beginning uptrend could still be supplanted by a continuation of the downtrend.
The Russell 2000 is technically more bullish (less bearish?) than all the other equity indices.
Summary
Last week was the first time that the decline from 1370 did not make a new low, but it is too soon for the bulls to declare victory. Next week is likely to tell us decisively if they can do so.
The QQQ -- which was lagging the SPX during the decline -- has gotten back in sync with it, but it did not close all that well on Friday, and this could offset the positives that were mentioned above.
Andre
FREE TRIAL SUBSCRIPTON
If precision in market timing for all time frames is something which is important to you, you should
consider a trial subscription to my service. It is free, and you will have four weeks to evaluate its
worth.
For a FREE 4-week trial, Send an email to: ajg@cybertrails.com.
For further subscription options, payment plans, and for important general information, I encourage
you to visit my website at www.marketurningpoints.com. It contains summaries of my background, my
investment and trading strategies and my unique method of intra-day communication with
subscribers. I have also started an archive of former newsletters.
The above comments about the financial markets are based purely on what I consider to be sound technical analysis principles. They
represent my own opinion and are not meant to be construed as trading or investment advice, but are offered as an analytical point of view
which might be of interest to those who follow stock market cycles and technical analysis.


No comments:
Post a Comment