=============
the ELLIOTT WAVE lives on
weekend update
REVIEW
Interesting week. After a sharp pullback early in the week, which looked like the beginning of a correction, the market rallied back by week's end to finish the week about unchanged. For the week the SPX/DOW were mixed, and the NDX/NAZ were +0.3%. Foreign markets were mostly lower, with Asian markets -0.9% and European markets -1.1%. On the economic front declining reports outpaced rising reports 7 to 3. On the uptick: ISM services, the ADP index, and the WLEI. On the downtick: factory orders, wholesale inventories, consumer credit, nonfarm payrolls, the monetary base, and both the trade deficit and weekly jobless claims increased. Next is FOMC week, and we'll get reports on retail sales, industrial production and the CPI/PPI. Best to your week!
LONG TERM: bull market
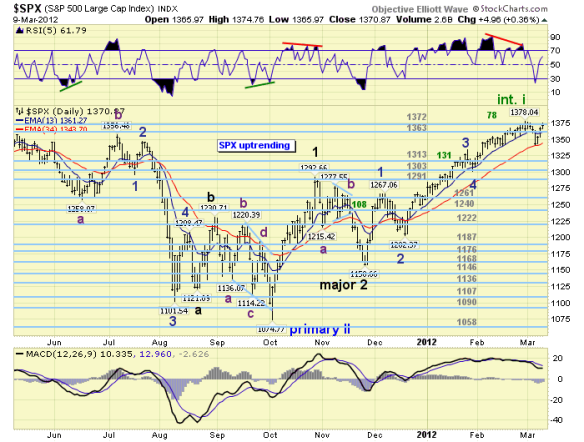
While we continue to sort out this relentless uptrend, which is now moving into its fourth month, the bull/bear market debate has all but vanished. Weekly technical indicators continue to move higher, and have clearly been in bull market territory for all of 2012. In fact, the weekly RSI/MACD are hitting new highs along with the NYAD market breadth. These are some signs of a bull market underway.
We continue to count this bull market as a Cycle wave [1] wave, from the Mar09 low, in progress. Cycle waves unfold in five Primary waves, and Primary waves I and II have already completed. Primary wave III has been underway since the Oct11 SPX 1075 low. Each rising Primary wave divides into five Major waves. Remember this is OEW, not EW.
Major wave 1 and 2, of Primary III, completed at the Nov11 SPX 1159 low. Major wave 3 is currently underway. Sometimes, as noted on the weekly chart, Major waves clearly divide into five Intermediate waves. The last time this occurred was during Major wave 1 of Primary wave I. We have been counting this lengthy uptrend as an Intermediate wave i. Should it exceed SPX 1400 before correcting we will be forced to upgrade the labeling one degree, to a Major wave 3 uptrend in progress. The market is not too far from that level at this time. However this turns out, we can now project, based on some QE data, this bull market is likely to top between SPX 1545 and 1586 in 2013. We posted this range on the monthly chart.
MEDIUM TERM: uptrend probably topped at SPX 1378
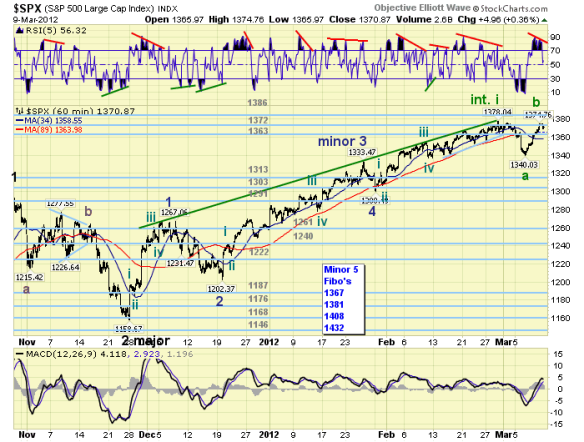
The current uptrend started in late November at SPX 1159 and hit 1378 a week ago, for a 19% gain in three months. The uptrend was fairly easy to count while it was rising. Since we are counting this uptrend as an Intermediate wave i, it naturally divided into five Minor waves. We counted these Minor waves as follows: wave 1 SPX 1267, wave 2 SPX 1202, wave 3 SPX 1333, wave 4 SPX 1300, and wave 5 potentially ending at SPX 1378. After it hit that level on February 29th, the market experienced the second largest pullback of the entire uptrend (1378-1340), 38 points. We assumed this was the beginning of a correction as we had counted five waves up from the low, and 10 of the 20 international indices we track confirmed downtrends.
After the initial decline to SPX 1340, which was a small abc, the market rallied to 1375 on friday, nearly retracing the entire decline. We have noticed this kind of action at the beginning of corrections before in this bull market. But the initial drops were much larger. The July11, Sept11 and the Nov11 corrections all retraced most of the initial decline before rolling over. You can easily observe this on the daily chart above. Despite the recent rally we continue to believe a correction will be the most probable outcome.
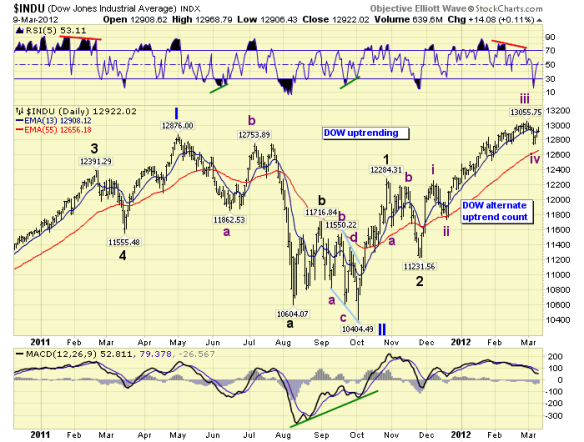
Last week we offered an alternate view for this uptrend and posted the labeling on the DOW charts. This count suggests the uptrend is still unfolding but it is a Major wave 3. We counted the early december high as Intermediate wave i, and the late february high as Intermediate wave iii. The recent pullback would have completed Intermediate wave iv, and wave v is underway now. Should the SPX start making new highs and exceed 1400 this is the most probable count.
SHORT TERM
Support for the SPX is at the 1363 pivot, the low 1350′s and 1340. Overhead resistance is at the 1372 and 1386 pivots. Short term momentum displayed a negative RSI divergence before dropping to neutral on friday.
For the past few weeks this uptrend has looked like it could top at any time. But it has continued to work its way higher and it's still near its highs. During the uptrend we have counted a complete set of waves at each Minor wave labeling. Then the decline from SPX 1378-1340 unfolded. This 38 point pullback was the largest one since mid-december, and the hourly RSI hit an oversold level that usually signals the beginning of a downtrend. Plus, the daily RSI hit its most oversold level since the previous Major wave 2 downtrend. Despite all these negative indications the market rebounded, retracing 35 of the 38 point decline by friday and ended the week at SPX 1371.
Currently we have the SPX completing Minute wave A at 1340, and possibly completing Minute wave B at 1375. Should the SPX rally to new highs the alternate DOW count would become the preferred count. The OEW 1386 pivot would be the next target and then the 1440 pivot after that. Should the market turn lower from current levels we would expect the OEW 1313 pivot to provide Minor wave A support. The weekly trend is still down until either SPX 1375 is cleared to the upside, or continues lower with 1340 being breached to the downside. Should the market resume its downtrend we're expecting the correction to end between the OEW 1261 and 1291 pivots. With the FOMC meeting on tuesday, and OPEX on friday this could be quite a volatile week. Best to your trading!
FOREIGN MARKETS
The Asian markets were mostly lower on the week for a net loss of 0.9%. Three of the seven indices we track are in confirmed downtrends.
The European markets were all lower on the week for a net loss of 1.1%. Six of the seven indices were track are in downtrends.
The Commodity equity group was also all lower for a net loss of 1.9%. One of the three are in a confirmed downtrend.
The DJ World index lost 0.6% on the week and is still in an uptrend.
COMMODITIES
Bonds remain in a downtrend losing 0.7% on the week.
Crude oil remains in an uptrend gaining 0.7% on the week.
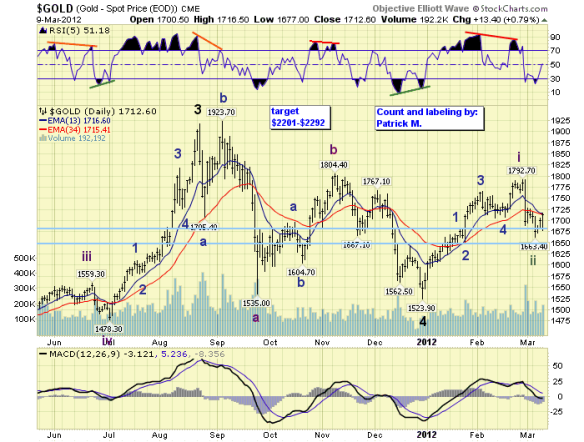
Gold may have completed its correction at tuesday's $1663 low. It hit our support range during the decline, we labeled that low with a 'green' Intermediate wave ii, and it has rallied over $50 in the last three days. For the week it had a net loss of 0.1%.
The USD continues its uptrend from the recent 78.10 low. It gained 0.8% on the week. The JPY continues it downtrend, with positive divergences, losing 0.8% on the week. And the EUR is close to confirming a downtrend, losing 0.6% on the week.
NEXT WEEK
Monday kicks off the economic week with the Budget deficit at 2:00. On tuesday the FED has its FOMC meeting, Retail sales will be reported at 8:30, and Business inventories at 10:00. On wednesday we'll have Export/Import prices. Then on thursday, weekly Jobless claims, the NY FED, and the PPI at 8:30, followed by the Philly FED at 10:00. On OPEX friday, we have the CPI at 8:30, then Industrial production at 9:15, and finally Consumer sentiment at 10:00. One speech scheduled on the FED's agenda: chairman Bernanke speaks about community banking on wednesday at 10:00. Best to your weekend and week!
CHARTS:http://stockcharts.com/def/servlet/Favorites.CServlet?obj=ID1606987


No comments:
Post a Comment