Folks, once again we can celebrate new stockmarket highs while continuing to be concerned about resistance levels and concerning indicators. In this post, I'm continuing my new format of providing links to the great work of other folks, where it's available, interweaving my own observations (and will post such other analysts work in the entirety if it isn't available elsewhere). The observations from last week projecting to a low on August 2 worked out incredibly well. I don't know if will always be that good, but now we are looking for a High Point early to middle of the upcoming week. I posted via Twitter my own charts showing the very noticeable negative divergence on the McClellan Oscillator charts for both NYSE and the NASDAQ. The McClellan Summation Index also has been rolling over. Which is concerning for the intermediate to longer-term. The volatility index dropped smartly, and it may be showing a potential profit-taking (or cell) time. Monday or Tuesday, possibly as late as Wednesday.
If it were just the VIX, that wouldn't be enough to call a top. It's the negative divergence that plays into this as well. Frankly, sentiment indicators are mixed. So it's also worth looking at other methods. One of those is Elliott Wave analysis, so be sure to review Tony Caldaro's weekend update | the ELLIOTT WAVE lives on, at http://caldaro.wordpress.com/2012/08/04/weekend-update-356/. Tony's update this weekend discusses why the stock market needs to start moving more smoothly upward, and not in more choppiness, in order to look bullish. He also talks about the importance of SPX 1355. He's made the great observation that on Thursday, the SPX tested 1355 as a 61.8% retracement to the prior week's low.
Mike Burke has produced his usual solid technical analysis report for the stock market, Technical Market Report for August 4, 2012 | Mike Burk | Safehaven.com, at http://www.safehaven.com/article/26426/technical-market-report-for-august-4-2012. This weekend, he's looking at the breadth indicators so you can see what he finds concerning, but also pointing out that seasonality favors a continued move to push higher in the upcoming week. Of course, read his report at this link to see the details and his conclusions.
The guys at "Change In Trend" are delighted about having nailed the low last week, so you'll want to see what they're saying about the potential for a high point around August 9, at The Drop Zone | Change-In-Trend: http://changeintrend.wordpress.com/2012/07/28/the-drop-zone/.
The technicians at MIG Bank publish fairly often at Safe Haven their analysis updates of currencies, gold and silver. In their latest at http://www.safehaven.com/article/26420/fed-hits-kill-switch-on-liquidity suggest that the euro is running right into resistance at slightly above 1.24 ($XEU, EUR/USD). If that's right, then the concomitant strength in the US dollar may provide a headwind for stocks, supporting the idea that stocks may stall out at resistance in the next few days.
Raymond Merriman had pointed out that August 2 would be an important date, and also that the time around August 8 will be one to watch next. In this weekend's preview column, he discusses in more detail what we should look out for this week as well as the rest of this month (even including the President's birthday August 4). Check it out at http://www.mmacycles.com/weekly-preview/mma-comments-for-the-week/mma-comments-for-the-week-beginning-august-6,-2012/.
For the bigger perspective, Droke has written an article at http://www.safehaven.com/article/26420/fed-hits-kill-switch-on-liquidity about the interaction of the Fed and central banks' decisions on liquidity, and the long-wave cycles. He doesn't seem to indicate whether he believes the market will move to new all-time highs, but he does seem to think that after early 2013 the dominant pressure is downward.
Showing posts with label Elliott Wave / Caldaro's OEW. Show all posts
Showing posts with label Elliott Wave / Caldaro's OEW. Show all posts
Saturday, August 4, 2012


Saturday, July 28, 2012
Thoughts on a small pullback before SPX moves higher in early August 2012
There appear to be various indications that we could have a small pullback before the stock market moves higher. Such a pullback might last for only one day, so be aware of that. The FOMC is coming up next week, and normally we would also expect the new months, new money effect to produce higher prices in the later part of the week, August 1-3. At this point, be prepared for the possibility of a dip on Monday, and then be alert for whether Thursday, August 2 will be a high or low. A pullback may only retest SPX 1350's to 1360. Be sure to read Tony Caldaro's Objective Elliott Wave weekend update at http://caldaro.wordpress.com/2012/07/28/weekend-update-355/. He mentions the importance of SPX 1344 in case there's an overbought pullback. He also addresses bonds, currencies, commodities, and other countries' indices.
A potential wildcard in all this is that today, July 28, is a Bradley turn date. I'm told that the Bradley turn dates have been having better accuracy this year. Normally, I don't put much stock in them, and even today we cannot be certain whether this is producing a high right now, or will it simply give us a pullback before a further move up. Just something to keep in mind with all else.
One concerning note is that the McClellan Oscillator didn't make a higher high than it did early July, which looks like a non- confirmation so far. It's early yet, so just another reason to consider a pullback. It'll become more concerning if the indices advance higher without higher highs in the oscillator. It's the one chart I wanted to include with this post (other charts I already posted last night via Twitter) but having technical difficulty click on the Twitter pic link to see it: . The Summation Index is also rolling over, which supports the concerns that the longer term might not be so good either. There's a similar point about the VIX, it made a higher low (not a lower low) so that's a bearish divergence. Also there's a short- term trading signal on VIX that bought Thursday and closes out Monday. Again just something to consider for the weeks ahead. It's also noteworthy that the Dow Industrials $DJI $INDU are stronger, while the Nasdaq 100 $NDX and Russell 2000 $RUT are weaker.
Assuming we pullback a day or so, before we move higher, how high? There seem to be various reasons to expect the SPX to rise above 1400 again.** After that, it's a matter of whether this really is a bull market that will carry on to new higher highs, or at least rise above 1500 again. Or, will the market roll over again and retest the June 4 lows about 1260's to 1280, or go even lower. Personally, I think it can go either way. That's why I think it is increasingly important to be flexible, and to pay attention to timing since the timing of a low or high - rather than absolute price - can be the way to decide whether to hold or fold, and when to re-enter.
**NOTE - I just watched and do recommend Chris Ciovacco's charts analysis video at http://ciovaccocapital.com/wordpress/index.php/stock-market-us/bulls-still-in-control/ covering the SPX, equities in general such as other countries and financials, the VIX, internals and breadth, and DeMark indicators status & projections. I'm impressed by the quality and clarity of his analysis; so I highly recommend watching it. Doesn't change my thinking but he does a great job of showing why this market is more bullish than many realize - if support holds!
One cycles source that is proving to be very interesting is the "Change in Trend" blog, and you should take a look at the new post there, at http://changeintrend.wordpress.com/2012/07/28/the-drop-zone/. Their information suggests that August 9 may be a high, and I am also seeing from various cycle methods that August 6-9, and especially August 8 or 9, may be a very significant high.
The week that includes August 8 and 9 is also an important week in terms of the Tom Demark indicators, I've been told. I'm no expert in that method, although I have begun to study up. It is my understanding that, since that will be week 9 after the June 4 low, and so long as the Demark support levels are not violated (seems no problem now), the market will be set up for a "Wave C" down to retest the June 4 lows. So that's something to consider too!
This is all in context of the bigger cycles. It's important to understand that the four-year cycle may or may not have topped out. If it has, then the idea of retesting and moving under the June 4 lows becomes quite serious. Otherwise, if the four-year cycle has not topped out, then we could see higher prices around October to November 2012, and even during the year 2013. I've seen good analyses that would project an important peak either in the spring, or in Jun, or August 2013.
One more note: Terry Laundry passed away earlier this month. His remarkable T Theory - which many appreciated, and others don't agree - often pointed to important tops. He used to provide audio commentary about this at TTheory.com. His last commentary July 7, 2012 described a mega-T that topped mid-2011 and another (40-year vintage) that topped March 2012. He seemed to think that was it, and the market shouldn't produce any new higher highs for a few years. The work will be left to Parker Binion who's carrying forward Terry's work to help determine if there might be any more ancient T's that might produce higher highs, or was the early 2012 peak all that we get before the bear market sets in.
May as well note also that Martin Armstrong has written a new post at his blog, at http://armstrongeconomics.com/2012/07/28/dow-jones-rally/. He doesn't get very specific for free, but mentions both the ideas of a high August or September, along with a possible panic but not clear if that might be during August or more in September, even October.
These are ideas to ponder until we get past mid-August. For now, it's a matter of navigating the next two weeks.
A potential wildcard in all this is that today, July 28, is a Bradley turn date. I'm told that the Bradley turn dates have been having better accuracy this year. Normally, I don't put much stock in them, and even today we cannot be certain whether this is producing a high right now, or will it simply give us a pullback before a further move up. Just something to keep in mind with all else.
One concerning note is that the McClellan Oscillator didn't make a higher high than it did early July, which looks like a non- confirmation so far. It's early yet, so just another reason to consider a pullback. It'll become more concerning if the indices advance higher without higher highs in the oscillator. It's the one chart I wanted to include with this post (other charts I already posted last night via Twitter) but having technical difficulty click on the Twitter pic link to see it: . The Summation Index is also rolling over, which supports the concerns that the longer term might not be so good either. There's a similar point about the VIX, it made a higher low (not a lower low) so that's a bearish divergence. Also there's a short- term trading signal on VIX that bought Thursday and closes out Monday. Again just something to consider for the weeks ahead. It's also noteworthy that the Dow Industrials $DJI $INDU are stronger, while the Nasdaq 100 $NDX and Russell 2000 $RUT are weaker.
Assuming we pullback a day or so, before we move higher, how high? There seem to be various reasons to expect the SPX to rise above 1400 again.** After that, it's a matter of whether this really is a bull market that will carry on to new higher highs, or at least rise above 1500 again. Or, will the market roll over again and retest the June 4 lows about 1260's to 1280, or go even lower. Personally, I think it can go either way. That's why I think it is increasingly important to be flexible, and to pay attention to timing since the timing of a low or high - rather than absolute price - can be the way to decide whether to hold or fold, and when to re-enter.
**NOTE - I just watched and do recommend Chris Ciovacco's charts analysis video at http://ciovaccocapital.com/wordpress/index.php/stock-market-us/bulls-still-in-control/ covering the SPX, equities in general such as other countries and financials, the VIX, internals and breadth, and DeMark indicators status & projections. I'm impressed by the quality and clarity of his analysis; so I highly recommend watching it. Doesn't change my thinking but he does a great job of showing why this market is more bullish than many realize - if support holds!
One cycles source that is proving to be very interesting is the "Change in Trend" blog, and you should take a look at the new post there, at http://changeintrend.wordpress.com/2012/07/28/the-drop-zone/. Their information suggests that August 9 may be a high, and I am also seeing from various cycle methods that August 6-9, and especially August 8 or 9, may be a very significant high.
The week that includes August 8 and 9 is also an important week in terms of the Tom Demark indicators, I've been told. I'm no expert in that method, although I have begun to study up. It is my understanding that, since that will be week 9 after the June 4 low, and so long as the Demark support levels are not violated (seems no problem now), the market will be set up for a "Wave C" down to retest the June 4 lows. So that's something to consider too!
This is all in context of the bigger cycles. It's important to understand that the four-year cycle may or may not have topped out. If it has, then the idea of retesting and moving under the June 4 lows becomes quite serious. Otherwise, if the four-year cycle has not topped out, then we could see higher prices around October to November 2012, and even during the year 2013. I've seen good analyses that would project an important peak either in the spring, or in Jun, or August 2013.
One more note: Terry Laundry passed away earlier this month. His remarkable T Theory - which many appreciated, and others don't agree - often pointed to important tops. He used to provide audio commentary about this at TTheory.com. His last commentary July 7, 2012 described a mega-T that topped mid-2011 and another (40-year vintage) that topped March 2012. He seemed to think that was it, and the market shouldn't produce any new higher highs for a few years. The work will be left to Parker Binion who's carrying forward Terry's work to help determine if there might be any more ancient T's that might produce higher highs, or was the early 2012 peak all that we get before the bear market sets in.
May as well note also that Martin Armstrong has written a new post at his blog, at http://armstrongeconomics.com/2012/07/28/dow-jones-rally/. He doesn't get very specific for free, but mentions both the ideas of a high August or September, along with a possible panic but not clear if that might be during August or more in September, even October.
These are ideas to ponder until we get past mid-August. For now, it's a matter of navigating the next two weeks.
Saturday, July 21, 2012
Choppiness & pullback still consistent with bull market: Tony Caldaro's 7/21/12 OEW update
If the markets seem off-kilter to you, Tony Caldaro has some great explanations of where they're headed and why (thanks again Tony!) Tony discusses U.S. & global stock markets, bonds, the U.S. dollar and other currencies, crude oil and other commodities, precious metals, and many individual stocks in his publics charts list. Use his charts link at the bottom to view all of his public charts. You can also find his daily market updates via his tweets as @OEWtony on Twitter, linking to his OEW website http://caldaro.wordpress.com/, or right here in the OEW feed at lower right side of the page.
=============
the ELLIOTT WAVE lives on
July 21, 2012
weekend update
by Tony Caldaro
=============
the ELLIOTT WAVE lives on
July 21, 2012
weekend update
by Tony Caldaro
REVIEW
Another interesting week. The market started the week by heading lower into early tuesday. Then rallied to new uptrend highs on thursday before pulling back on friday's Opex. Spain's IBEX dropped 5.6% on friday, assisting the SPX pullback, as their 10YR yields pushed over 7% again. Nevertheless, for the week the SPX/DOW were +0.40%, and the NDX/NAZ were +0.95%. Foreign markets were mixed with Asia +0.8%, Europe -1.3%, and the DJ World index +0.5%. Economic reports for the week were split with 7 improving and 7 declining. On the uptick: NY FED, CPI, housing starts, NAHB, industrial production, and the WLEI plus Philly FED improved. On the downtick: retail sales, business inventories, capacity utilization, building permits, weekly jobless claims, existing home sales, and leading indicators. Next week we get reports on housing, durable goods, and Q2 GDP.
LONG TERM: bull market
It has been said, it is easy to be bullish when markets are rising and then to turn bearish when they start to decline. Yet with nearly 85% of the international markets we track in bear markets, and only the US, and possibly England and Switzerland, in long term uptrend ends. How does one easily determine which are rising and which have started declines?

While some of the major US indices, in recent months, have offered mixed signals in their wave patterns. The bellwether DOW continues to track this bull market with clarity and precise waves. Our long term count, from the March 2009 bear market low, remains the same. A multi-year Cycle wave [1] began at that low which should divide into five Primary waves. Primary waves I and II completed at SPX 1371 and 1075 in 2011. Primary wave III has been underway since then. Within each Primary wave there are five Major waves. Notice how Major wave 1 of Primary I subdivided into five Intermediate waves, and Major 1 of Primary III has done likewise. Major wave 3 should now be underway from the SPX 1267 Major wave 2 low. We are anticipating Major 3 will be a multi-month uptrend which may last until year end, and carry the SPX up to the OEW 1499 pivot.
MEDIUM TERM: choppy uptrend
For the past several weeks we have been vacillating back and forth between new bull markets highs ahead or a retest of the SPX 1267 low. We have been observing a choppy type of uptrend from that low, and knew the 2-year Tech cycle low was due soon. This week, tuesday, the SOX index appeared to put in that low.

When one compares the SOX index with the SPX it is easily seen that one does not get very far without the other. When the SOX is rising the SPX rises with it. Yet, when the SOX stalls or heads lower, the SPX goes sideways or declines as well. Notice the action in the SOX/SPX since their coincident June lows. They both started off uptrending, but the SPX became quite choppy when the SOX stalled and started downtrending. So which index is leading the other. The answer to that question depends on the 2-year cycle.

When the 2-year cycle bottoms the SOX takes over leadership, driving specifically the Tech stocks higher and general market, until the upward surge off that low ends. This can take anywhere from 6 – 12 months. Then the general market takes over leadership. Compare the two indices after each 2-year cycle low on their weekly charts from 2002.

After the SOX index bottoms it usually surges about 8+% in a few days. Then it pulls back losing about half of that gain before resuming the new uptrend. Tuesday to thursday's surge was +8.3%, and friday it began its pullback. It's acting like the typical kickoff after a 2-year cycle low.
This would help explain the overall choppiness in the general market during this uptrend. The Tech cycle was bottoming while the Cyclicals were trying to rise. Should the Sox index, semiconductors, start rising as expected the SPX uptrend should start to appear more impulsive. If not, and there is another low ahead. We would then expect the SPX to retest just the late June low at 1309, before resuming the uptrend.
We recently completed a 50 year study on our WROC buy signal. Thank you Alan for the data. These signals usually occur prior to an OEW uptrend confirmation. The latest one occurred in June. Over the entire period 1962-2012 they were accurate nearly 90% of the time. During a bull market their accuracy rises to 96%. We also found, during bull markets WROC buys signals only occurred 11% of the time during B wave uptrends. So the chance of this uptrend being a B wave, of an ongoing Major wave 2 correction, is only 11%.
SHORT TERM
Medium term support for the SPX is now at the 1363 and 1313 pivots, with resistance at the 1372 and 1386 pivots. Short term support is at the 1363 pivot, SPX 1342/47 and 1333/38. Short term resistance is at the OEW 1372 and 1386 pivots, plus SPX 1402/03. Short term momentum ended the week quite oversold.

During the week we upgraded our projections, for this uptrend, based upon the activity in the SOX index. After reviewing the charts this weekend we have also upgraded our labeling on the SPX chart, from Minor and Minute waves 1 and 2, to Intermediate and Minor waves 1 and 2. The rally was SPX 1267-1363 was sufficient for an Intermediate wave i advance, and Intermediate wave iii should now be underway from SPX 1309. Minor wave 1 can be counted from SPX 1309-1375, with Minor 2 at 1325. Minor wave 3, of Int. iii, should be currently underway. The other count we are tracking, if the SOX 2-year low is not in place yet, is posted on the DOW charts.

Should the uptrend resume after this pullback, as expected, we can now project a Minor wave 3 target near SPX 1432 (Minor 3 = 1.62 Minor 1). This nears the range of the OEW 1440 pivot. Then an Intermediate wave iii target near SPX 1464 (Int. iii = 1.62 Int. i). Then an uptrend high for Major wave 3 near SPX 1507 (Int iii-v = 2.0 Int. i). This nears the range of the OEW 1499 pivot. This all depends on how the SOX index responds to its recent low. Best to your trading!
FOREIGN MARKETS
The Asian markets gained 0.8% on the week. All indices, but China, are in uptrends.
The European markets lost 1.3% on the week. Mostly due to declines in Spain and Italy on friday. All indices still uptrending, with the two noted as a possible exception.
The Commodity equity group gained 0.7% on the week. All but Brazil are in uptrends.
The DJ World index is uptrending and gained 0.5% on the week.
COMMODITIES
Bonds remain quite resilient despite the uptrend in stocks and commodities. Still uptrending and gained 0.2% on the week.
Crude continues to uptrend and gained 5.7% on the week.
Gold remains in a choppy uptrend, which has not made a higher high since June, and lost 0.3% on the week.
The USD is still uptrending gaining 0.2% on the week. While the EUR keeps downtrending, losing 0.7% on the week.
NEXT WEEK
Tuesday kicks off the economic week with the FHFA housing price index. On wednesday we'll get New homes sales. Then on thursday weekly Jobless claims, Durable goods orders and Pending home sales. On friday, Q2 GDP (estimates +1.5%) and Consumer sentiment. FED governor Raskin gives a speech monday night, and FED chairman Bernanke gives a speech tuesday morning. The next FOMC meeting is tuesday/wednesday July 31 and August 1st. Best to your weekend and week!
Saturday, July 14, 2012
Hedging appropriate unless bull proves: Tony Caldaro's 7/14/12 OEW update
Ouch, the market didn't stay over SPX 1358 let alone 1360-1362! Any who stayed long are fortunate it rebounded well yesterday! So Tony Caldaro has recalibated his objective Elliott Wave update analysis (thanks again Tony!) Tony also addresses global stock markets, bonds, the U.S. dollar and other currencies, crude oil and other commodities, and many individual stocks in his publics charts list. Use his charts link at the bottom to view all of his public charts. You can also find his daily market updates via his tweets as @OEWtony on Twitter, linking to his OEW website http://caldaro.wordpress.com/, or right here in the OEW feed at lower right side of the page.
=============
the ELLIOTT WAVE lives on
July 14, 2012
weekend update
by Tony Caldaro
=============
the ELLIOTT WAVE lives on
July 14, 2012
weekend update
by Tony Caldaro
REVIEW
On a week to week basis it does not look like the market had done much: SPX 1355 last friday, SPX 1357 this friday. During the week, however, the market had quite a roller coaster ride. A gap up opening on tuesday was sold as the SPX hit 1362. Then the market hit its low for the week thursday morning at SPX 1325. A full reversal followed, and in just over 24 hours the week ended with a marginal gain. For the week the SPX/DOW were +0.10%, but the NDX/NAZ were -1.05%. Foreign markets were also mixed. Asian markets lost 1.9%, Europeans markets gained 0.3%, and the DJ World index was -0.6%. Economic reports for the week continued their winning streak, with positives outpacing negatives 6 to 5. On the uptick: consumer credit, the PPI, WLEI and the monetary base, plus the trade deficit and weekly jobless claims improved. On the downtick: wholesale inventories, export/import prices, consumer sentiment and the budget deficit expanded. Next week we get a look at industrial production, the FED's beige book and housing.
LONG TERM: bull market
While most of the world's stock indices are in bear markets. We're still projecting an ongoing bull market in the US, and possibly England and Switzerland. The bull market that started in March 2009 at SPX 667, hit SPX 1422 in April and we project it will hit the mid-1500′s during 2013. Our wave count remains the same: a five Primary wave bull market underway to complete Cycle wave [1] of the new Supercycle.

Primary waves I and II completed at SPX 1371 and 1075 respectively, in May and October 2011. Primary wave III has been underway since then. Primary wave I divided into five Major waves, with Major wave 1 subdividing into five Intermediate waves. Major wave 1 of Primary III has also subdivided into five Intermediate waves. The only question now in the long term count is if Major wave 2 bottomed at SPX 1267, or is still in progress.
MEDIUM TERM: choppy uptrend continues
Four weeks ago the market generated a WROC buy signal. These signals usually precede uptrend confirmations and are better than 90% reliable. Shortly thereafter the market did confirm an uptrend as the SPX has risen from 1267 to 1375. These buys signals, however, do not differentiate between impulsive and corrective uptrends. Thoughout this bull market we have had 19 WROC buy signals. None of them have failed to occur during uptrends. However, there were two B wave uptrends during 2011, that were fully retraced, which also generated WROC buy signals. Therefore, the recent buy signal does not rule out the possibility that this uptrend is a B wave.

When examining in detail both rallies during this uptrend, SPX 1267-1363 and SPX 1309-1375, neither look that implusive. The first looks like an ABC: SPX 1336-1307-1363, as does the second: SPX 1334-1313-1375. This would suggest this uptrend is, thus far, a double zigzag B wave, and not the beginning of Major wave 3. In fact, after six weeks, this uptrend does not even have the look of a third wave. Third waves are typically strong impulsive moves. Just like Major wave 3 of Primary I, and the two Intermediate wave iii's of Primary's I and III. This uptrend is looking more and more like an Intermediate B wave of Major wave 2. The count posted on the DOW/NAZ charts. This would imply an eventual retest of the SPX 1267 low, when this uptrend concludes.

SHORT TERM
Support for the SPX remains at the 1313 and 1303 pivots, with resistance at the 1363 and 1372 pivots. Short term momentum ended the week quite overbought. Thus far the uptrend, as noted above, looks like a series of ABC's rather than 5′s. The uptrend has unfolded in three waves: 1267-1363 (96 points), and 1309-1375 (66 points). Oddly enough, this uptrend is now also forming an upward rising channel, which is posted on the SPX daily and hourly charts.
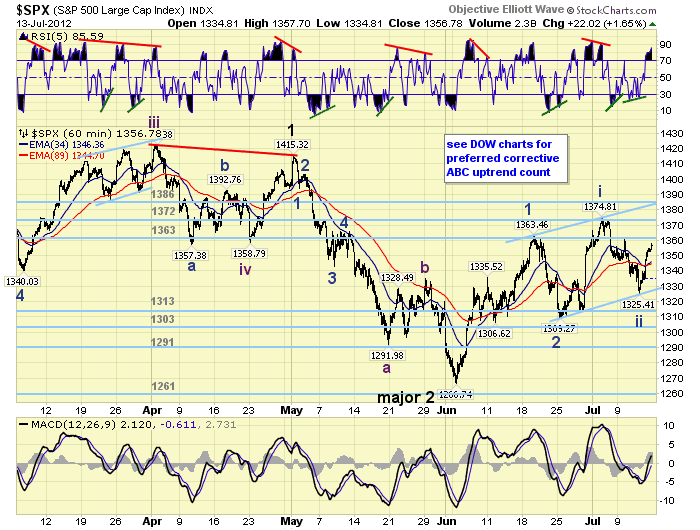
The significance of this channel is threefold. Should the SPX break through the upper trendline, this uptrend could still advance in what was expected to be a Major wave 3. Should the SPX remain within the channel, the uptrend could make a higher high. Should the SPX break below the lower trendline, it is quite probable the uptrend ended as a corrective ABC at SPX 1375. Thus far this uptrend looks more like a day traders market, than an investors buy and hold market. With friday's close just a bit more than 1% below the uptrend high it may be a good time to do some hedging.
Short term support is at SPX 1342/47, 1334/38 and 1324/27. Overhead resistance is at the 1363, 1372 and 1386 pivots. Short term momentum ended the week quite overbought, and a pullback can now occur at any time. The short term OEW charts swung positive again with the rally over the SPX 1346 swing point. Best to your trading!
FOREIGN MARKETS
The Asian markets were mostly lower on the week for a net loss of 1.9%. All but China remain in uptrends.
The European markets were mostly higher on the week for a net gain of 0.3%. All indices remain in uptrends.
The Commodity equity group were mixed for a net loss of 0.8%. All but Brazil are in uptrends.
The uptrending DJ World index lost 0.6% on the week.
COMMODITIES
Bonds have not confirmed a downtrend yet and continue to drift higher gaining 0.1% on the week.
Crude remains in an uptrend gaining 3.2% on the week.
Gold is in a choppy uptrend and added 0.2% on the week.
The USD continues to uptrend, but was relatively flat on the week.
NEXT WEEK
A full calendar ahead for the week. On monday Retail sales and the NY FED at 8:30, then Business inventories at 10:00. Tuesday, we have the CPI, Industrial production and the NAHB housing index. Wednesday, Housing starts, Building permits and the FED's beige book. Then on thursday, weekly Jobless claims, Existing home sales, the Philly FED and Leading indicators. On tuesday and wednesday FED chairman Bernanke testifies before the Senate and House, respectively, on the semiannual monetary policy report. Best to your weekend and week!
Saturday, July 7, 2012
SPX may surprise with bullishness: Tony Caldaro's 7/7/12 OEW update
Investors including KI$$ swings should stay long if/when the SPX lifts above 1358, says Tony Caldaro - we may be about to embark on a big bullish wave up! So read this objective Elliott Wave update, which also builds on last weekend's comprehensive review across the markets (thanks again Tony!) Tony also addresses global stock markets, bonds, the U.S. dollar and other currencies, crude oil and other commodities, and many individual stocks in his publics charts list. Use his charts link at the bottom to view all of his public charts. You can also find his daily market updates via his tweets as @OEWtony on Twitter, linking to his OEW website http://caldaro.wordpress.com/, or right here in the OEW feed at lower right side of the page.
=============
the ELLIOTT WAVE lives on
July 7, 2012
weekend update
by Tony Caldaro
=============
the ELLIOTT WAVE lives on
July 7, 2012
weekend update
by Tony Caldaro
REVIEW
Overall it was a good week for the US stock market. The SPX eclipsed its previous uptrend high at 1363, on its way to 1375 on tuesday. Then after the mid-week holiday a pullback followed, from extremely overbought condtions. By week's end the SPX/DOW were -0.7%, but the NDX/NAZ were flat. Overseas markets were mixed as well, with Asia +1.3%, Europe -1.1%, and the DJ World index -0.2%. On the economic front it was another positive week with positive reports outpacing negative ones 7 - 3. On the downtick: ISM manufacturing/services and investor sentiment. On the uptick: construction spending, factory orders, auto sales, the ADP index, the WLEI, plus Payrolls rose and weekly jobless claims declined. Next week we'll have the FOMC minutes, the twin deficits and the PPI.
LONG TERM: bull market
As we near the end of the seventh year of writing this blog the US bull market we have been tracking remains intact. While many EW'ers have disagreed with our analysis over the years. For the most part I think we have helped investors navigate these treacherous markets during this deflationary secular bear cycle.
Our super long term count continues to suggest a multi-century Grand Supercycle bull market ended in 1929. Then the stock market lost 89% of its value in just 34 months in a Grand Supercycle bear market. At that July, 1932 DOW 41.22 low the next multi-century GSC began. Within a GSC bull market there are five Supercycle waves. The first Supercycle, SC1, concluded in October, 2007 at DOW 14,198. The decline that followed that peak was the largest since that 1929-1932 bear market. The DOW lost 54% of its value in just 17 months. This was a faster rate of decline than even the GSC bear market. In March, 2009 SC2 ended at DOW 6470, and a multi-decade SC3 bull market began.
Supercycle bull markets unfold in five Cycle waves. The first Cycle wave, [1], has been underway since that low. The first Cycle wave of SC1 (1932-2007), took five years to unfold (1932-1937). This one may take that long, or end one year shorter in 2013. It all depends on how long the waves take to unfold. Within each rising Cycle wave is five Primary waves. Primary waves I and II concluded in April and October 2011. Primary wave III has been underway since that October low. When it concludes the market should experience a Primary wave IV correction, followed by a rising Primary wave V to end the bull market and Cycle wave [1]. After that a Cycle wave [2] bear market should follow for two or three years. Then the real excitement begins as Cycle wave [3] kicks off.

Our weekly chart displays the SC1 2007 top, SC2 2009 bottom, and the current Cycle wave [1] bull market. Our indicators continue to perform in the usual bullish mode. The MACD has remained mainly above neutral. Plus, the RSI has been getting quite overbought during uptrends and barely oversold during downtrends. Observe these indicators during the previous 2002-2007 bull market. Currently we have a bull market target between SPX 1536 and 1556 by 2013.
MEDIUM TERM: uptrend
After the Primary wave II low the market advanced in five Intermediate waves to complete Major wave 1, of Primary III. Notice Major wave 1, of Primary I, also subdivided into five Intermediate waves. The Major wave 2 correction that followed was shorter than the previous Major wave 2, in time. Major 2, Primary I, was three months. But Major 2, of Primary III, was only one month.
What we are expecting now is an extended, multi-month, possibly into the end of the year, uptrend for Major wave 3. During this bull market we have observed two uptrends that have lasted for seven months: Intermediate iii of Major 1, and Major 3 of Primary I. Our upside target for this entire advance is the OEW 1499 pivot.

Currently we are counting the first rally off the Major 2 SPX 1267 low to SPX 1363 as Minor wave 1, or possibly Intermediate wave i. The pullback to SPX 1309 is counted as Minor 2, or possibly Intermediate ii. Minor wave 3, (or Intermediate iii), has been underway since that low. If all goes as expected, the pullbacks during this wave should be relatively small, 20 – 30 SPX points, until it completes in a few months.
SHORT TERM
SPX support is at the OEW 1313 and 1303 pivots, with resistance at the 1363 and 1372 pivots. The uptrend has progressed from SPX 1267 to 1363, Minor wave 1. Then pulled back to SPX 1309/10/13, Minor wave 2. The recent rally to SPX 1375 looks like Minute wave i, with friday's 1348 low Minute wave ii of Minor 3. While a further pullback for Minute ii is possible we think it's unlikely at this time since the market did get quite oversold. Once the SPX clears the 1358 level we believe the uptrend should resume to new highs.

Short term support is at the SPX 1342/47 area and then 1334/38. Overhead resistance is at the 1363 and 1372 pivots. Short term momentum hit quite oversold on friday before rebounding toward neutral. The short term OEW charts remain positive with the swing point still around SPX 1350. Best to your trading and week!
FOREIGN MARKETS
The Asian markets were mostly higher on the week for a net gain of 1.3%. All but China are in confirmed uptrends.
The European markets were mostly lower on the week for a net loss of 1.1%. All indices are in confirmed uptrends.
The Commodity equity group were all higher on the week for a net gain of 1.0%. All but Brazil are in confirmed uptrends.
The DJ World index is uptrending but lost 0.2% on the week.
COMMODITIES
Bonds remain somewhat resilient gaining 0.7% on the week and still in an uptrend.
Crude had its usual volatile week losing 0.7%, but is uptrending.
Gold gave up 0.8% on the week, but remains in an uptrend.
Currencies have been wild of late. The USD confirmed down, then up again recently gaining 2.1% this week. The EUR is downtrending again losing 3.0%, while the downtrending JPY gained 0.2%.
NEXT WEEK
Monday kicks off the economic week with Consumer credit at 3:00. Wednesday we have the Trade deficit, Wholesale inventories, and the FOMC minutes. Then on thursday, weekly Jobless claims, Export/Import prices, and the Budget deficit. Friday, the PPI and Consumer sentiment. The FED has nothing scheduled at this time. Best to your weekend and week!
Saturday, June 30, 2012
Can you spare a paradigm? Here's a surprising one! Tony Caldaro's 6/30/12 OEW update
Daytraders don't need paradigms but they're vital for investors and swing traders. Tony Caldaro's outdone himself now, showing the big picture across markets and asset classes. Bookmark this one! and read on below (thanks again Tony!). His Objective Elliott Wave work is the best of any Elliott Wave analysis, that's why we feature his reports. Tony also addresses global stock markets, bonds, the U.S. dollar and other currencies, crude oil and other commodities, and many individual stocks in his publics charts list. Use his charts link at the bottom to view all of his public charts. You can also find his daily market updates via his tweets as @OEWtony on Twitter, linking to his OEW website http://caldaro.wordpress.com/, or right here in the OEW feed at lower right side of the page.
=============
the ELLIOTT WAVE lives on
June 30, 2012
weekend update
by Tony Caldaro
=============
the ELLIOTT WAVE lives on
June 30, 2012
weekend update
by Tony Caldaro
REVIEW
Another wild week on Wall Street as the market had gap openings on four of the five days. In the end it was a positive week as there was a gap up opening on friday which took the market to its highest levels of the week. Even the economic news improved somewhat to a balance between positive and negative reports. On the uptick: new/pending home sales, Case-Shiller home prices, durable goods orders, the Chicago PMI and weekly jobless claims ticked down. On the downtick: consumer confidence/sentiment, personal spending, new home prices, the monetary base and the WLEI. For the week the SPX/DOW were +1.95%, and the NDX/NAZ were +1.35%. Asian markets rallied 1.3%, European markets rose 2.8%, and the DJ World index gained 2.4%. Next week we have a mid-week holiday with reports on ISM, and on friday the monthly Payrolls report.
BIG PICTURE
We thought it would be best this week to start off with the big picture in a few of the world's asset classes. As we all know, medium term trend changes can sometimes be mistaken for long term changes. Therefore it is a good practice, as the saying goes, to keep a sharp eye on the forest before examining its trees.

We covered the Commodity asset class over the weekend. We counted a five Primary wave bull market from 1998 to 2008. Then a Primary A wave decline into 2009, followed by a B wave advance into 2011. Long term we expect commodities to head lower.

We also covered the Precious metals asset class last weekend. This chart has a similar count from the 1999/2001 low topping in 2011. We believe the precious metals are now in potentially a long term bear market.
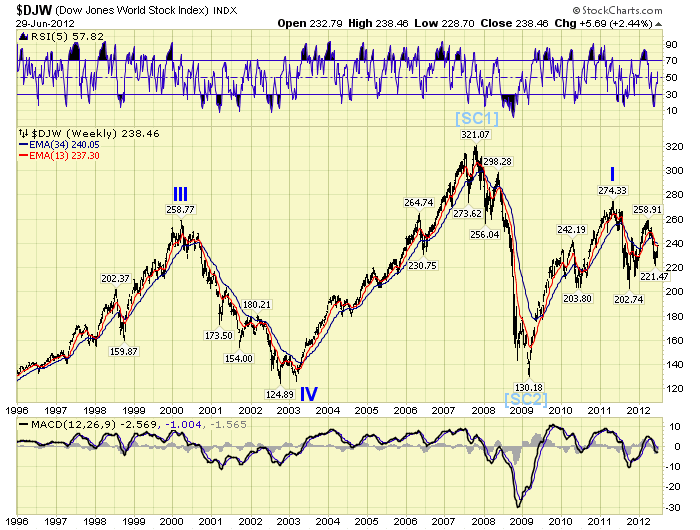
The next asset class is the DJ World stock index. We count a Primary wave III top in 2000, followed by a Primary wave IV low in 2002, then a Primary wave V high in 2007. The 2007 high is marked as the end of a multi-decade Supercycle wave that started in 1932/42. What followed that peak was the biggest crash and market decline, (60% worldwide), since the 1929-1932 bear market. This bear market, we believe, ended in 2009 and concluded that Supercycle wave. After that low, a two year bull market followed into 2011. Now, equity markets in general are in a bear market. The US, and possibly England and Switzerland appear to be the only exceptions at this time.

We wrote a report of a major change underway last year in the Currencies. Not much has changed, except many of the currencies have confirmed our views. The USD has generally been in a major bear market since 1985 when it hit 164.72. As you can see it has lost more than half its value since then. It did have somewhat of a bull market between 1995 and 2001 when it rose a bit more than 50%. That low and high were labeled Cycle waves [A] and [B] respectively. It has been in a Cycle wave [C] bear market since then. Typically at the end of a bear market the USD establishes a low, in this case Primary wave A at 72.70. Then rallies in a Primary B wave, which may have recently completed at 83.54. This is followed by a higher Primary wave C low to end the Cycle. After this occurs, possibly by 2013/14, the USD should soar into the end of the decade. Potentially it could double. Considering we do not expect the USD to make a lower low than 2011, we would state it appears to be in a long term bull market.

The last asset class covered is the US 30-year Bond. Interest rates on the long term bond have generally been declining since they peaked in 1981 at 14.59%. Recently the 30-year hit an all time low of 2.51%. We have been counting this entire bear market in rates as a series of ABC's: a triple zigzag. The last C wave, of the last zigzag, may have completed at the recent low. This would suggest long term rates should start rising for the next three decades. It should be gradual at first as a new bull market in rates takes hold. This also suggests bond prices should soon start declining. The worse time for investors to own long term bonds is when interest rates are rising. Unless held to maturity.
In conclusion. Commodities, precious metals, worldwide stock indices, and US government bonds are either in, or entering, bear markets. There are, however, selected sectors within these bear markets that are still in bull markets. For example, the US stock market and possibly England's and Switzerland's equity market should make new bull market highs into 2013. These new highs may coincide with the expected USD low in 2013. After that, it would appear the USD and short term US Treasury bills will be the place to be for a couple of years. Plus, US real estate.
LONG TERM: bull market
The US bull market we have been tracking now for three years is still underway. This market has had its share of disappointments and surprises but it continues to unfold. The count we have been carrying is different than the one presented above for the world market indices. While we believe world equity markets generally topped in 2011 the US market remains bullish and in a slightly different pattern.
Our count suggests a Supercycle wave [2] low occurred in 2009, and a Cycle wave [1] bull market is underway. The Cycle wave bull market should unfold in five Primary waves. Primary waves I and II completed in Apr11 and Oct11 respectively. Primary wave III has been underway since then. Within at least two of the rising Primary waves there should be five clearly defined Major waves. Primary wave I displays five Major waves with a subdividing Major wave 1. Primary wave III is also starting off with the same pattern. A Major wave 1 that subdivided into five Intermediate waves.

After Major wave 1, in Primary I, concluded Major wave 2 was a three month, and somewhat complex, zigzag. All other corrections during Primary I lasted only one month. Major wave 2, in Primary III, thus far appears to be a simple zigzag. And, it has only lasted one month if one uses the bellwether DOW count. Whether or not Major wave 2 has concluded at the early June low we'll examine in the next section. When Major wave 3 unfolds it should be a lengthy uptrend lasting possibly six to seven months. Then a quick Major wave 4 down should be followed by a short rising Major wave 5 to conclude Primary wave III. After a Primary wave IV correction, a rising Primary wave V should unfold to end the bull market sometime in mid to late 2013. Currently it looks like the DOW will make all time new highs before the bull market concludes.
MEDIUM TERM: uptrend confirmation pending
After a thorough review of all the charts and indicators it is quite clear markets worldwide had an impressive week. Even though it did not show up in the final weekly numbers. In fact, 80% of the world's indices are in confirmed uptrends or nearing one. This is quite a shift from last week when not one international index was in a confirmed uptrend. In the currency markets the USD joined the JPY in a confirmed downtrend, while the EUR and CHF are now in uptrends. In fact, friday's 1.7% surge in the EUR can be categorized as a rare event. A surge like this occurs only two to three times a year, and is usually at the beginning, or early part, of a stock market uptrend.

In the US, all nine of the SPX sectors we track are in confirmed uptrends or close to it. Indicators such as the VIX and Corporate bond risk are either in a confirmed downtrend or will confirm shortly. Even 1 year rates now have five waves up from their 0.08% record low yield in 2011. It was quite a week!

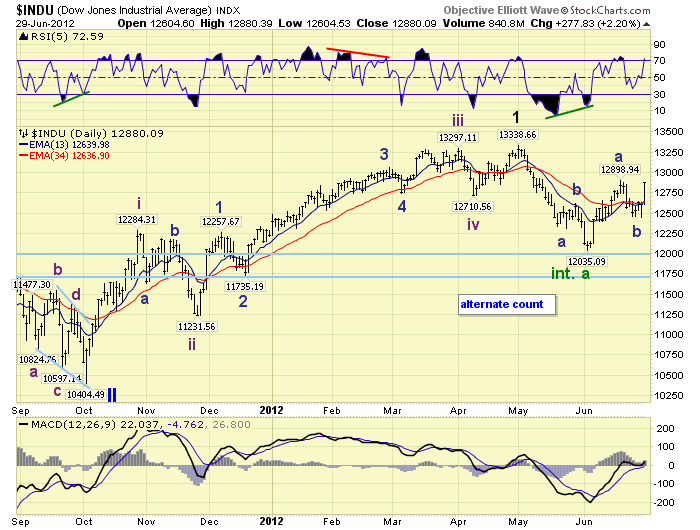
The major four US indices have been displaying three potential bullish counts, during Primary III, for the past month or so. We have decided to narrow it down to two: the DOW count and the NDX count. The bellwether cyclical DOW displays a Major wave 1 high, of Primary III, in May12. The growth NDX displays a Major wave 3 high, of Primary III, in Mar12. We have adjusted the cyclical SPX to align with the DOW count, counting its May high as a fifth wave failure.
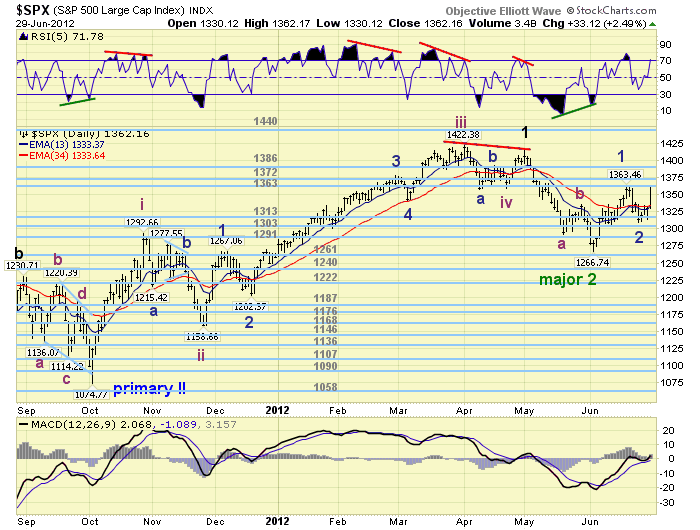
Three weeks ago we received a WROC buy signal. These signals usually arrive at the beginning of a potential uptrend, and are 90+% accurate. After reviewing the initial rally from SPX 1267 – 1363 it appeared to be a bit choppy, corrective even, suggesting we could get an uptrend. But it could be just an Intermediate B wave rally. We still see this as a possibility. As a result we have decided to continue to carry this count, but as an alternate. This alternate count is posted on the DOW and NAZ charts, with the primary count on the SPX and NDX charts.
SHORT TERM:
Support for the SPX remains at the 1313 and 1303 pivots, with resistance at the 1363 and 1372 pivots. Short term momentum hit extremely overbought on friday and closed there. The initial rally from the early June low at SPX 1267 rose to 1363. A pullback followed to SPX 1309 by monday, a retest on tuesday at 1310, then another retest on thursday at 1313 when the DOW made a lower low. Late on thursday the market started to rally, and continued that rally into friday ending at SPX 1362. The entire seven trading day pullback was nearly recaptured in one day. Quite impressive!
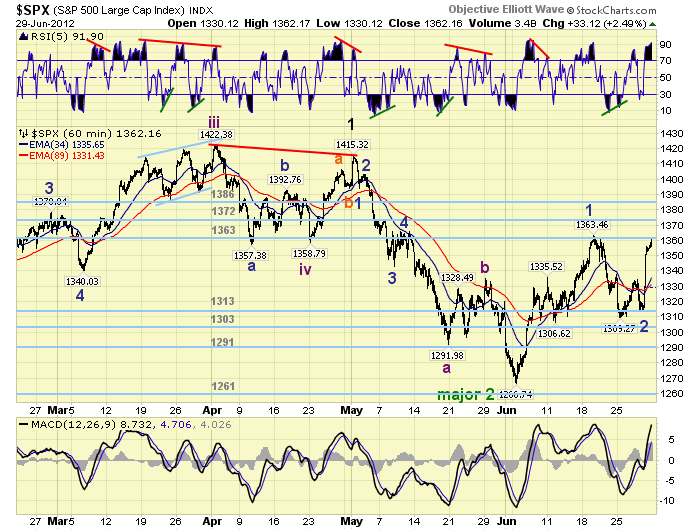
With all the previous bullish observations in mind we have labeled the initial advance to SPX 1363 as Minor wave 1, of Intermediate wave i, of Major wave 3. Minor wave 2 should have ended at the SPX 1309, 1310, 1313 complex low. The late thursday/friday rally should be the beginning of Minor wave 3. Initial resistance for this advance is at the 1363, 1372 and 1386 pivots. Support remains at SPX 1342/47, 1334/37 and 1324/27. With the market hitting extremely overbought on friday, a pullback into initial support at SPX 1342/47 would be quite normal. The short term OEW charts turned positive on thursday when the market rallied above SPX 1327. The positive/negative swing point is now around SPX 1334. Best to your trading, and happy 4th of July.
FOREIGN MARKETS
The Asian markets were nearly all higher on the week for a net gain of 1.3%. India and South Korea are now in confirmed uptrends.
The European markets were all higher on the week for a gain of 2.8%. Spain has already confirmed an uptrend.
The Commodity equity group were mixed on the week for a net gain of 1.6%. Canada is in a confirmed uptrend.
The DJ World index rose 2.4% on the week and nearly confirmed an uptrend.
COMMODITIES
Bonds fluctuated a bit this week ending with a 0.3% gain. Bonds are getting close to confirmed a downtrend.
Crude continued lower for most of the week hitting $77.28 on thursday. Then rallied to close the week at $84.82 for a net gain of 6.1% on the week.
Gold has been quite choppy since its May low at $1527, but rallied strongly on friday for a net gain of 1.7% on the week. Gold is now in a confirmed uptrend.
The USD rallied early in the week, but gave it all back on friday for a net loss of 0.8% on the week. The USD is now in a confirmed downtrend. The EUR (+0.7%) and CHF (0.7%) are in confirmed uptrends, while the JPY (+0.8%) remains in a downtrend.
NEXT WEEK
With a holiday, 4th of July, scheduled in mid-week volume is expected to be somewhat on the light side in the US. On monday ISM manufacturing and Construction spending will be released at 10:00. On tuesday, Factory orders and monthly Auto sales. Then on thursday, the ADP index, weekly Jobless claims, and ISM services. The monthly Payrolls report closes out the week on friday. The FED has nothing scheduled at this time. The ECB, however, meets on thursday. Best to your weekend, holiday and week!
Subscribe to:
Posts (Atom)


 Posts
Posts

