There appear to be various indications that we could have a small pullback before the stock market moves higher. Such a pullback might last for only one day, so be aware of that. The FOMC is coming up next week, and normally we would also expect the new months, new money effect to produce higher prices in the later part of the week, August 1-3. At this point, be prepared for the possibility of a dip on Monday, and then be alert for whether Thursday, August 2 will be a high or low. A pullback may only retest SPX 1350's to 1360. Be sure to read Tony Caldaro's Objective Elliott Wave weekend update at http://caldaro.wordpress.com/2012/07/28/weekend-update-355/. He mentions the importance of SPX 1344 in case there's an overbought pullback. He also addresses bonds, currencies, commodities, and other countries' indices.
A potential wildcard in all this is that today, July 28, is a Bradley turn date. I'm told that the Bradley turn dates have been having better accuracy this year. Normally, I don't put much stock in them, and even today we cannot be certain whether this is producing a high right now, or will it simply give us a pullback before a further move up. Just something to keep in mind with all else.
One concerning note is that the McClellan Oscillator didn't make a higher high than it did early July, which looks like a non- confirmation so far. It's early yet, so just another reason to consider a pullback. It'll become more concerning if the indices advance higher without higher highs in the oscillator. It's the one chart I wanted to include with this post (other charts I already posted last night via Twitter) but having technical difficulty click on the Twitter pic link to see it: . The Summation Index is also rolling over, which supports the concerns that the longer term might not be so good either. There's a similar point about the VIX, it made a higher low (not a lower low) so that's a bearish divergence. Also there's a short- term trading signal on VIX that bought Thursday and closes out Monday. Again just something to consider for the weeks ahead. It's also noteworthy that the Dow Industrials $DJI $INDU are stronger, while the Nasdaq 100 $NDX and Russell 2000 $RUT are weaker.
Assuming we pullback a day or so, before we move higher, how high? There seem to be various reasons to expect the SPX to rise above 1400 again.** After that, it's a matter of whether this really is a bull market that will carry on to new higher highs, or at least rise above 1500 again. Or, will the market roll over again and retest the June 4 lows about 1260's to 1280, or go even lower. Personally, I think it can go either way. That's why I think it is increasingly important to be flexible, and to pay attention to timing since the timing of a low or high - rather than absolute price - can be the way to decide whether to hold or fold, and when to re-enter.
**NOTE - I just watched and do recommend Chris Ciovacco's charts analysis video at http://ciovaccocapital.com/wordpress/index.php/stock-market-us/bulls-still-in-control/ covering the SPX, equities in general such as other countries and financials, the VIX, internals and breadth, and DeMark indicators status & projections. I'm impressed by the quality and clarity of his analysis; so I highly recommend watching it. Doesn't change my thinking but he does a great job of showing why this market is more bullish than many realize - if support holds!
One cycles source that is proving to be very interesting is the "Change in Trend" blog, and you should take a look at the new post there, at http://changeintrend.wordpress.com/2012/07/28/the-drop-zone/. Their information suggests that August 9 may be a high, and I am also seeing from various cycle methods that August 6-9, and especially August 8 or 9, may be a very significant high.
The week that includes August 8 and 9 is also an important week in terms of the Tom Demark indicators, I've been told. I'm no expert in that method, although I have begun to study up. It is my understanding that, since that will be week 9 after the June 4 low, and so long as the Demark support levels are not violated (seems no problem now), the market will be set up for a "Wave C" down to retest the June 4 lows. So that's something to consider too!
This is all in context of the bigger cycles. It's important to understand that the four-year cycle may or may not have topped out. If it has, then the idea of retesting and moving under the June 4 lows becomes quite serious. Otherwise, if the four-year cycle has not topped out, then we could see higher prices around October to November 2012, and even during the year 2013. I've seen good analyses that would project an important peak either in the spring, or in Jun, or August 2013.
One more note: Terry Laundry passed away earlier this month. His remarkable T Theory - which many appreciated, and others don't agree - often pointed to important tops. He used to provide audio commentary about this at TTheory.com. His last commentary July 7, 2012 described a mega-T that topped mid-2011 and another (40-year vintage) that topped March 2012. He seemed to think that was it, and the market shouldn't produce any new higher highs for a few years. The work will be left to Parker Binion who's carrying forward Terry's work to help determine if there might be any more ancient T's that might produce higher highs, or was the early 2012 peak all that we get before the bear market sets in.
May as well note also that Martin Armstrong has written a new post at his blog, at http://armstrongeconomics.com/2012/07/28/dow-jones-rally/. He doesn't get very specific for free, but mentions both the ideas of a high August or September, along with a possible panic but not clear if that might be during August or more in September, even October.
These are ideas to ponder until we get past mid-August. For now, it's a matter of navigating the next two weeks.
Showing posts with label Year 2012 Overview. Show all posts
Showing posts with label Year 2012 Overview. Show all posts
Saturday, July 28, 2012
Saturday, June 30, 2012
Can you spare a paradigm? Here's a surprising one! Tony Caldaro's 6/30/12 OEW update
Daytraders don't need paradigms but they're vital for investors and swing traders. Tony Caldaro's outdone himself now, showing the big picture across markets and asset classes. Bookmark this one! and read on below (thanks again Tony!). His Objective Elliott Wave work is the best of any Elliott Wave analysis, that's why we feature his reports. Tony also addresses global stock markets, bonds, the U.S. dollar and other currencies, crude oil and other commodities, and many individual stocks in his publics charts list. Use his charts link at the bottom to view all of his public charts. You can also find his daily market updates via his tweets as @OEWtony on Twitter, linking to his OEW website http://caldaro.wordpress.com/, or right here in the OEW feed at lower right side of the page.
=============
the ELLIOTT WAVE lives on
June 30, 2012
weekend update
by Tony Caldaro
=============
the ELLIOTT WAVE lives on
June 30, 2012
weekend update
by Tony Caldaro
REVIEW
Another wild week on Wall Street as the market had gap openings on four of the five days. In the end it was a positive week as there was a gap up opening on friday which took the market to its highest levels of the week. Even the economic news improved somewhat to a balance between positive and negative reports. On the uptick: new/pending home sales, Case-Shiller home prices, durable goods orders, the Chicago PMI and weekly jobless claims ticked down. On the downtick: consumer confidence/sentiment, personal spending, new home prices, the monetary base and the WLEI. For the week the SPX/DOW were +1.95%, and the NDX/NAZ were +1.35%. Asian markets rallied 1.3%, European markets rose 2.8%, and the DJ World index gained 2.4%. Next week we have a mid-week holiday with reports on ISM, and on friday the monthly Payrolls report.
BIG PICTURE
We thought it would be best this week to start off with the big picture in a few of the world's asset classes. As we all know, medium term trend changes can sometimes be mistaken for long term changes. Therefore it is a good practice, as the saying goes, to keep a sharp eye on the forest before examining its trees.

We covered the Commodity asset class over the weekend. We counted a five Primary wave bull market from 1998 to 2008. Then a Primary A wave decline into 2009, followed by a B wave advance into 2011. Long term we expect commodities to head lower.

We also covered the Precious metals asset class last weekend. This chart has a similar count from the 1999/2001 low topping in 2011. We believe the precious metals are now in potentially a long term bear market.

The next asset class is the DJ World stock index. We count a Primary wave III top in 2000, followed by a Primary wave IV low in 2002, then a Primary wave V high in 2007. The 2007 high is marked as the end of a multi-decade Supercycle wave that started in 1932/42. What followed that peak was the biggest crash and market decline, (60% worldwide), since the 1929-1932 bear market. This bear market, we believe, ended in 2009 and concluded that Supercycle wave. After that low, a two year bull market followed into 2011. Now, equity markets in general are in a bear market. The US, and possibly England and Switzerland appear to be the only exceptions at this time.

We wrote a report of a major change underway last year in the Currencies. Not much has changed, except many of the currencies have confirmed our views. The USD has generally been in a major bear market since 1985 when it hit 164.72. As you can see it has lost more than half its value since then. It did have somewhat of a bull market between 1995 and 2001 when it rose a bit more than 50%. That low and high were labeled Cycle waves [A] and [B] respectively. It has been in a Cycle wave [C] bear market since then. Typically at the end of a bear market the USD establishes a low, in this case Primary wave A at 72.70. Then rallies in a Primary B wave, which may have recently completed at 83.54. This is followed by a higher Primary wave C low to end the Cycle. After this occurs, possibly by 2013/14, the USD should soar into the end of the decade. Potentially it could double. Considering we do not expect the USD to make a lower low than 2011, we would state it appears to be in a long term bull market.

The last asset class covered is the US 30-year Bond. Interest rates on the long term bond have generally been declining since they peaked in 1981 at 14.59%. Recently the 30-year hit an all time low of 2.51%. We have been counting this entire bear market in rates as a series of ABC's: a triple zigzag. The last C wave, of the last zigzag, may have completed at the recent low. This would suggest long term rates should start rising for the next three decades. It should be gradual at first as a new bull market in rates takes hold. This also suggests bond prices should soon start declining. The worse time for investors to own long term bonds is when interest rates are rising. Unless held to maturity.
In conclusion. Commodities, precious metals, worldwide stock indices, and US government bonds are either in, or entering, bear markets. There are, however, selected sectors within these bear markets that are still in bull markets. For example, the US stock market and possibly England's and Switzerland's equity market should make new bull market highs into 2013. These new highs may coincide with the expected USD low in 2013. After that, it would appear the USD and short term US Treasury bills will be the place to be for a couple of years. Plus, US real estate.
LONG TERM: bull market
The US bull market we have been tracking now for three years is still underway. This market has had its share of disappointments and surprises but it continues to unfold. The count we have been carrying is different than the one presented above for the world market indices. While we believe world equity markets generally topped in 2011 the US market remains bullish and in a slightly different pattern.
Our count suggests a Supercycle wave [2] low occurred in 2009, and a Cycle wave [1] bull market is underway. The Cycle wave bull market should unfold in five Primary waves. Primary waves I and II completed in Apr11 and Oct11 respectively. Primary wave III has been underway since then. Within at least two of the rising Primary waves there should be five clearly defined Major waves. Primary wave I displays five Major waves with a subdividing Major wave 1. Primary wave III is also starting off with the same pattern. A Major wave 1 that subdivided into five Intermediate waves.

After Major wave 1, in Primary I, concluded Major wave 2 was a three month, and somewhat complex, zigzag. All other corrections during Primary I lasted only one month. Major wave 2, in Primary III, thus far appears to be a simple zigzag. And, it has only lasted one month if one uses the bellwether DOW count. Whether or not Major wave 2 has concluded at the early June low we'll examine in the next section. When Major wave 3 unfolds it should be a lengthy uptrend lasting possibly six to seven months. Then a quick Major wave 4 down should be followed by a short rising Major wave 5 to conclude Primary wave III. After a Primary wave IV correction, a rising Primary wave V should unfold to end the bull market sometime in mid to late 2013. Currently it looks like the DOW will make all time new highs before the bull market concludes.
MEDIUM TERM: uptrend confirmation pending
After a thorough review of all the charts and indicators it is quite clear markets worldwide had an impressive week. Even though it did not show up in the final weekly numbers. In fact, 80% of the world's indices are in confirmed uptrends or nearing one. This is quite a shift from last week when not one international index was in a confirmed uptrend. In the currency markets the USD joined the JPY in a confirmed downtrend, while the EUR and CHF are now in uptrends. In fact, friday's 1.7% surge in the EUR can be categorized as a rare event. A surge like this occurs only two to three times a year, and is usually at the beginning, or early part, of a stock market uptrend.

In the US, all nine of the SPX sectors we track are in confirmed uptrends or close to it. Indicators such as the VIX and Corporate bond risk are either in a confirmed downtrend or will confirm shortly. Even 1 year rates now have five waves up from their 0.08% record low yield in 2011. It was quite a week!

The major four US indices have been displaying three potential bullish counts, during Primary III, for the past month or so. We have decided to narrow it down to two: the DOW count and the NDX count. The bellwether cyclical DOW displays a Major wave 1 high, of Primary III, in May12. The growth NDX displays a Major wave 3 high, of Primary III, in Mar12. We have adjusted the cyclical SPX to align with the DOW count, counting its May high as a fifth wave failure.

Three weeks ago we received a WROC buy signal. These signals usually arrive at the beginning of a potential uptrend, and are 90+% accurate. After reviewing the initial rally from SPX 1267 – 1363 it appeared to be a bit choppy, corrective even, suggesting we could get an uptrend. But it could be just an Intermediate B wave rally. We still see this as a possibility. As a result we have decided to continue to carry this count, but as an alternate. This alternate count is posted on the DOW and NAZ charts, with the primary count on the SPX and NDX charts.

SHORT TERM:
Support for the SPX remains at the 1313 and 1303 pivots, with resistance at the 1363 and 1372 pivots. Short term momentum hit extremely overbought on friday and closed there. The initial rally from the early June low at SPX 1267 rose to 1363. A pullback followed to SPX 1309 by monday, a retest on tuesday at 1310, then another retest on thursday at 1313 when the DOW made a lower low. Late on thursday the market started to rally, and continued that rally into friday ending at SPX 1362. The entire seven trading day pullback was nearly recaptured in one day. Quite impressive!

With all the previous bullish observations in mind we have labeled the initial advance to SPX 1363 as Minor wave 1, of Intermediate wave i, of Major wave 3. Minor wave 2 should have ended at the SPX 1309, 1310, 1313 complex low. The late thursday/friday rally should be the beginning of Minor wave 3. Initial resistance for this advance is at the 1363, 1372 and 1386 pivots. Support remains at SPX 1342/47, 1334/37 and 1324/27. With the market hitting extremely overbought on friday, a pullback into initial support at SPX 1342/47 would be quite normal. The short term OEW charts turned positive on thursday when the market rallied above SPX 1327. The positive/negative swing point is now around SPX 1334. Best to your trading, and happy 4th of July.
FOREIGN MARKETS
The Asian markets were nearly all higher on the week for a net gain of 1.3%. India and South Korea are now in confirmed uptrends.
The European markets were all higher on the week for a gain of 2.8%. Spain has already confirmed an uptrend.
The Commodity equity group were mixed on the week for a net gain of 1.6%. Canada is in a confirmed uptrend.
The DJ World index rose 2.4% on the week and nearly confirmed an uptrend.
COMMODITIES
Bonds fluctuated a bit this week ending with a 0.3% gain. Bonds are getting close to confirmed a downtrend.
Crude continued lower for most of the week hitting $77.28 on thursday. Then rallied to close the week at $84.82 for a net gain of 6.1% on the week.
Gold has been quite choppy since its May low at $1527, but rallied strongly on friday for a net gain of 1.7% on the week. Gold is now in a confirmed uptrend.
The USD rallied early in the week, but gave it all back on friday for a net loss of 0.8% on the week. The USD is now in a confirmed downtrend. The EUR (+0.7%) and CHF (0.7%) are in confirmed uptrends, while the JPY (+0.8%) remains in a downtrend.
NEXT WEEK
With a holiday, 4th of July, scheduled in mid-week volume is expected to be somewhat on the light side in the US. On monday ISM manufacturing and Construction spending will be released at 10:00. On tuesday, Factory orders and monthly Auto sales. Then on thursday, the ADP index, weekly Jobless claims, and ISM services. The monthly Payrolls report closes out the week on friday. The FED has nothing scheduled at this time. The ECB, however, meets on thursday. Best to your weekend, holiday and week!
Saturday, June 23, 2012
Fed-fueled bull market code cracked, despite pullback? Tony Caldaro's 6/23/12 OEW update
Is there a formulaic code fueling bullishness in the U.S. stock market, and will a deeper pullback here lead to higher highs at least in the U.S.? Maybe... Tony Caldaro's update will surprise you, so read it below (thanks again Tony!). His Objective Elliott Wave work is the best of any Elliott Wave analysis, that's why we feature his reports. Tony also addresses global stock markets, bonds, the U.S. dollar and other currencies, crude oil and other commodities, and many individual stocks in his publics charts list. Use his charts link at the bottom to view all of his public charts. You can also find his daily market updates via his tweets as @OEWtony on Twitter, linking to his OEW website http://caldaro.wordpress.com/, or right here in the OEW feed at lower right side of the page.
=============
the ELLIOTT WAVE lives on
June 23, 2012
weekend update
by Tony Caldaro
=============
the ELLIOTT WAVE lives on
June 23, 2012
weekend update
by Tony Caldaro
REVIEW
While most of the world's equity markets have turned bearish again after their 2010/2011 advances, we continue to track what we believe is a bullish US stock market. Now that the recent liquidity cycle is coming to an end, we'll explain why we have this view, both technically and fundamentally. This week the market continued to rally into the tuesday/wednesday FOMC meeting, with expectations of a new quantitative easing program: QE 3. When the FED did not deliver, extending only Operation Twist, the market became quite volatile on wednesday and sold off dramatically on thursday. Friday we saw an oversold rebound. For the week the SPX/DOW were -0.80%, but the NDX/NAZ were +0.65%. Asian markets gained 0.2%, European markets gained 1.0%, and the DJ World index lost 0.3%. In the end not a bad week. Economic reports again came in heavily to the downside: six down and two up. On the uptick: building permits and the leading indicators. On the downtick: housing starts, existing home sales, FHFA housing prices, the Philly FED, the WLEI and weekly jobless claims rose. Next week Q1 GDP on thursday, plus PCE prices and the Chicago PMI on friday.
LONG TERM: bull market
Technically, we have been tracking a bull market since March 2009. Our historical analysis of Secular cycles suggests a very significant low occurred at that time. The price low of the cycle. What always follows after this event is a bull market. The difficult part has been tracking this one, even though we know where the significant waves began and ended. Our preferred count remains unchanged. We're expecting a five Primary wave bull market to complete a Cycle wave [1]. The first two Primary waves completed in April and October 2011, at SPX 1371 and 1075 respectively. Primary wave III has been underway since then.

In the DOW we have a clear five wave pattern up from the end of Primary wave II. We are counting it as five completed Intermediate waves ending Major wave 1 of Primary III. The recent, and possibly ongoing downtrend, is/will be labeled Major wave 2. Observe Major wave 1 of Primary I also subdivided into five Intermediate waves. And, Major wave 2 was a bit complex. We are maintaining a slightly different count on the SPX charts, as an alternate count. The SPX failed to make a new high, along with the DOW, in May. So its pattern deviated, somewhat, from the bellwether DOW. This has not occurred in over six years. It's a more bullish count and we give it a lower probability.

Fundamentally, the markets have been in a FED driven liquidity cycle since late 2008. When the Treasury Department started the $800 bln TARP program in October 2008, the FED initated QE1 at $200 bln. Clearly neither were enough to offset the deflationary pressures as the market made new lows into March 2009. Then on March 10th 2009 the FED expanded the QE1 program to $1.4 tln until June 2010. The stock market soared, rallying from a Mar09 low of SPX 667 to SPX 1220 by Apr10. Anticipating the end of QE1 the stock market began to correct. When the FED failed to extend QE1, or introduce a new program at their June meeting, the market made lower lows into July. From that low at SPX 1011 another rally began. Then on August 27th the FED introduced QE2 at $600 bln until June 2011. The market soared again, hitting SPX 1371 by May 2011. And again, it began to correct in anticipation of QE2 ending.
When the FED failed to introduce another liquidity program, and troubles in Europe widened, the correction steepened. While the stock market was going through this 22% correction the FED introduced a $400 bln Operation Twist on September 21st until June 2012. The market was disappointed and continued lower. In October 2011 the EU introduced a $1 tln EFSF program, similar to TARP. The market then bottomed at SPX 1075 and started to rally. The ECB then introducted LTRO 2 in December and the market continued to rally. In March 2012, anticipating the end of Op Twist in June, the market hit SPX 1422 and began to correct. This month the market hit a low of SPX 1267, then rallied for two weeks ahead of last week's FOMC meeting. After the meeting the FED expanded Op Twist from $400 to $667 bln until December 2012. The stock market quickly sold off the following day. This is a summary of the liquidity cycle and its effects on the stock market over the past four years.
If one examines the liquidity programs and their results they will discover a pattern. We are fairly certain the FED has as well. When the FED expanded QE1 to $1.4 tln the market closed that day at SPX 720. Before the program ended the SPX hit 1220, for a gain of 69%. When the FED introduced QE2 at $600 bln the market closed that day at SPX 1065. Before that program ended the SPX hit 1371, for a gain of 29%. Then when the FED introduced Op Twist for $400 bln the market closed that day at SPX 1167. The market was initially disappointed as it made a lower low. However before the program was recently expanded the SPX had hit 1422, for a gain of 22%. When the FED expanded the program this week by an odd $267 bln we figured they too had discovered the pattern.
For every $20 bln the FED purchases in long term debt the stock market rises 1%. QE1 was $1.4 tln: expected rise 70%, actual rise 69%. QE2 was $600 bln: expected rise 30%, actual rise 29%. Op Twist was $400 bln: expected rise 20%, actual rise 22%. Op Twist expanded to $667 bln: expected overall rise 33%, actual rise yet to be determined. In summary, when the FED introduced Op Twist for $400 bln they were expecting the market to rise 20%. Despite the decline after the introduction at SPX 1167, the market rose 22% to SPX 1422. Now, with the expansion of the program to $667 bln they are likely expecting an overall rise of 33.3% from the time the program was first introduced. Or, a rise of 13.3 % from the time it was extended. A 33.3% rise from SPX 1167 equals SPX 1556. A 13.3% rise from SPX 1356 equals SPX 1536. The all time high for the SPX is 1576. Mission almost accomplished!

MEDIUM TERM: downtrend likely resuming
The recent downtrend began in May with the DOW high, or in March with the SPX high if you prefer. We prefer the bellwether DOW. From the May high the correction clearly took on the form of an ABC: [1415] 1291-1335-1267. After that low the market had a fairly good rally to SPX 1363, or better than a 61.8% retracement of the decline. We also received a WROC buy signal along the way, which are 90+% reliable that an uptrend is underway. The internal wave count of this rally, however, looks more corrective than impulsive. We tried to fit various potential impulse counts into this rally with little success. This leaves us with two potential alternatives. First, either the downtrend is still underway. Second, this is a corrective B wave uptrend.

This bull market has had B wave uptrends before in 2011. However, when we factor in the recent liquidity injection by the FED. This would appear to be an uncharacteristic response to the expansion of Operation Twist. The most probable scenario, considering the correctiveness of the rally, would be to retest the lows at SPX 1267 or make a lower low. When Op Twist was first introduced in September 2011 the market sold off about 100 points into the October low. Another 100 point decline, this time from SPX 1363, would retest the early June lows and likely end the correction with a Major wave 2 flat in early July. We have updated the SPX/DOW charts to display this most probable scenario.
SHORT TERM
Support for the SPX is at the 1313 and 1303 pivots, with resistance at the 1363 and 1372 pivots. Short term momentum ended the week around neutral. The short term OEW charts remain with a negative bias with the swing point around SPX 1337.
The recent rally from SPX 1267 to 1363 started off impulsively as it was unfolding. We were expecting the rally to reach either the 1363 or 1372 pivots in a five wave sequence ahead of the FOMC meeting. The pattern, unfortunately, looked like three waves on tuesday as the FOMC began. After tuesday's high, and wednesday's volatility, the market sold off on thursday to SPX 1324. This selloff overlapped the first rally from SPX 1267 to 1329/36. This made the entire June rally look corrective. As a result we have labeled the SPX 1267 low as a wave A, and the recent rally as a wave B. The most probable scenario suggests a wave C is underway to either retest the June lows or make a lower low in early July.

Should the market exceed SPX 1363 before this occurs, we would assume the market is in a corrective larger B wave uptrend. Until this occurs the path of least resistance appears to be lower. Short term support is at SPX 1324/27 and the 1313/1303 pivots. Short term resistance is at SPX 1334/38, 1342/47 and the 1363 pivot. Short term momentum rebounded to neutral from extremely oversold. Should the market break the first support zone we'll assume the downtrend is resuming. Best to your trading!
FOREIGN MARKETS
The Asian markets were quite mixed for a gain of 0.2%. No confirmed uptrends yet.
The European markets were all higher for a gain of 1.0%. Still all downtrends.
The Commodity equity group were all lower for a net loss of 2.0%.
The DJ World index is still downtrending and lost 0.3% on the week.
COMMODITIES
Bond prices appear to be downtrending after their early June high. They lost 0.6% on the week. Corporate Bond risk has been declining rapidly suggesting the risk spread is narrowing.
Crude made another new low for its downtrend this week at $77.56. Crude declined 4.7% on the week. The lack of any QE programs are certainly impacting the commodity markets.
Gold lost 3.5% on the week as it appears its downtrend is continuing. For the first time since 2001 the long term pattern in Gold is starting to look negative.
The USD gained 0.8% on the week as stock market uncertainty fueled a one day spike in the USD. It is still officially in an uptrend.
NEXT WEEK
Monday kicks off an important economic week with New homes sales at 10:00. On tuesday we have Case-Shiller and Consumer confidence. Wednesday Durable goods orders and Pending home sales. Then on thursday Q1 GDP, estimate 1.9%, and weekly Jobless claims. On friday Personal income/spending, PCE prices, the Chicago PMI and Consumer sentiment. The FED has nothing scheduled. Best to your weekend and week!
Sunday, June 17, 2012
A contrarian, pro-Treasury bonds point of view
Last week started with US treasury bonds moving opposite of stocks, almost tagging a Fibonacci target below while stocks were well up. By the middle of the week, stocks had swooned though trying to recover, and bonds had stabilized. Then they both moved up together into the end of the week. This leaves the US treasury bonds not having traced a trend reversal pattern. At the same time, stocks have potentially traced a bearish trend reversal pattern, and only if they can make last week's highs into support do they have the potential to make new higher highs. Stock market numbers to watch include the Dow at Friday's high; or if above, then at 12,840 to 12,850. Given this potential bearish reversal in the US stock market, and the fact that other stock markets in the world are at much lower levels, this has a lot to do with why the US treasury bond market is holding up so well.
On a Fibonacci basis, it is possible for the US long bond ($USB or the futures /ZB) to actually make higher highs even up to the level of 160. To instead make a downward trend reversal here, it would have to move under 148 and even better 146 on strong selling volumes. We haven't seen that yet. The bond market may be smelling something that many stock investors haven't noticed yet.
Below are daily and monthly charts of the US long bond. I've also added a daily chart of TLT, the ETF that tracks the US long bond. The TLT chart shows that the selling volumes on the recent dip didn't even exceed the buying volumes that preceded during the most recent run up. We would also want to see more negative divergence going into the highest price, whenever "the top" does arrive.
You can see that, although there was a consolidation, a trend reversal pattern has not yet occurred. A trend reversal pattern would require lower lows on increased selling volumes. Until we see that, it's one clue that smart money is remaining in bonds, and may be avoiding stocks. There are even analysts now saying the stock market has topped out, and will only make its own pattern of lower highs the rest of this year and into next year. If that's true, then it supports the idea that US treasury bonds will do well for a long time. Even Martin Armstrong has recently (http://armstrongeconomics.com/693-2/2012-2/mirror-mirror/) explained why, in these uncertain times with other markets drooping and capital fleeing to perceived relative quality, the US dollar and US bonds may be one of the last holdouts of strength; at least until stocks reached whatever bottom they're going to find and finally make a long term cycle low-perhaps sometime next year or in 2014.
A similar discussion about why bonds are holding up so well is available from Terry Laundry in his audio commentary this weekend, at his "Best Bond Strategy" website at http://www.bestbondstrategy.com/.
All in all, given the uncertainties in stock markets and even commodities under pressure, it may not be such a great surprise that US Treasury bonds have proven resilient so far. They may continue to do well in the coming months. And if next year proves to be the significant risky time we've been bracing for, they may hold up into next year as well.
On a Fibonacci basis, it is possible for the US long bond ($USB or the futures /ZB) to actually make higher highs even up to the level of 160. To instead make a downward trend reversal here, it would have to move under 148 and even better 146 on strong selling volumes. We haven't seen that yet. The bond market may be smelling something that many stock investors haven't noticed yet.
Below are daily and monthly charts of the US long bond. I've also added a daily chart of TLT, the ETF that tracks the US long bond. The TLT chart shows that the selling volumes on the recent dip didn't even exceed the buying volumes that preceded during the most recent run up. We would also want to see more negative divergence going into the highest price, whenever "the top" does arrive.


You can see that, although there was a consolidation, a trend reversal pattern has not yet occurred. A trend reversal pattern would require lower lows on increased selling volumes. Until we see that, it's one clue that smart money is remaining in bonds, and may be avoiding stocks. There are even analysts now saying the stock market has topped out, and will only make its own pattern of lower highs the rest of this year and into next year. If that's true, then it supports the idea that US treasury bonds will do well for a long time. Even Martin Armstrong has recently (http://armstrongeconomics.com/693-2/2012-2/mirror-mirror/) explained why, in these uncertain times with other markets drooping and capital fleeing to perceived relative quality, the US dollar and US bonds may be one of the last holdouts of strength; at least until stocks reached whatever bottom they're going to find and finally make a long term cycle low-perhaps sometime next year or in 2014.
A similar discussion about why bonds are holding up so well is available from Terry Laundry in his audio commentary this weekend, at his "Best Bond Strategy" website at http://www.bestbondstrategy.com/.
All in all, given the uncertainties in stock markets and even commodities under pressure, it may not be such a great surprise that US Treasury bonds have proven resilient so far. They may continue to do well in the coming months. And if next year proves to be the significant risky time we've been bracing for, they may hold up into next year as well.
Sunday, June 10, 2012
See what's unseen in these financial markets: Andre Gratian's 6/10/12 Turning Points report
Technical analyses reveal what's going on under the surface of the markets, so be sure to read Andre Gratian's report below, because you may be surprised by his Turning Points update, covering the S&P 500, volatility index (VIX), the XLF (the financials ETF), bonds (TLT), the US dollar, gold and oil (thanks again, Andre!). You can get more info about Andre's work at his website (including his intraday update subscriber series), at http://www.marketurningpoints.com/. And now, Andre's update (click any of his charts to see it as a larger image):
SPX: Very Long-term trend – The very-long-term cycles are down and, if they make their lows when expected (after this bull market is over) there will be another steep and prolonged decline into late 2014. It is probable, however, that the steep correction of 2007-2009 will have curtailed the full downward pressure potential of the 120-yr cycle.
SPX: Intermediate trend – SPX is working on an intermediate low.
Analysis of the short-term trend is done on a daily basis with the help of hourly charts. It is an important adjunct to the analysis of daily and weekly charts which discusses the course of longer market trends.
Daily market analysis of the short term trend is reserved for subscribers. If you would like to sign up for a FREE 4-week trial period of daily comments, please let me know at ajg@cybertrails.com.
Market Overview
As anticipated in last week’s newsletter, which was entitled “MARKET LOW FORMING”, the indices did find a low on 6/04 and have been rising since. So far, the SPX has tacked on a quick 62 points, but may find the going a little tougher from this point on. Although Friday’s session was positive, the action looked tentative, cautious, as if the main players were sitting on the side lines ahead of the week-end. That could mean that they are expecting some news which may affect the market adversely. However, unless we see some significant weakness develop, this could turn out to be part of the consolidation which started on 6/09 and, when it’s over, we could go on to reach our intended target for this rally.
There are three potential projections. The most conservative is 1333. The next, which is moderate, is 1343. And there is an optimistic target of 1353. Since all of them exceed the high of 1329 which has already been reached, the odds favor a move past that level with the SPX deciding which target it wants to honor.
It is also possible that 1329 was “it” for now! At best, the SPX has only made a short-term low and it will have to do more work to turn it into an intermediate uptrend. This could entail expanding the current base, either by re-testing the former low of 1267, or even going beyond. Remember that there are still some unfilled projections from the top distribution pattern which call for potential lower targets -- perhaps as low as 1233. And since the daily indicators have not yet given a credible buy signal, the danger of exceeding the former low still exists. The near-term fate of the market should make itself known as early as at the opening, on Monday.
Chart analysis
As we do the majority of the time, we’ll start with the Daily Chart of the SPX. It’s easy to read and it gives us a good perspective on the market position. After correcting for a couple of months, the SPX found combined support from the lower channel line of the larger (blue) channel, the green line drawn across previous tops, and the bottom line of its short-term corrective (red) channel. That, in connection with the bottoming of several cycles pretty much ensured a rally.
However, there are remaining conditions which this rally will have to fulfill to continue. First, the SPX will have to overcome its previous high of 1335 and, although it has breached the decline’s short-term down-trend line, it will have to get out of the red channel before we can declare that a reversal has taken place. And there is something more subtle which suggests that this is more of an oversold bounce than a bona fide reversal. There is no visible deceleration in the decline! On its last down leg, the index went all the way to the bottom of the channel. My guess is that we will have to re-test that low and perhaps even go lower until some deceleration appears by its staying away from the lower line of the red channel. Until we see that, the odds that the market has made a low are questionable.
This analysis of the price action is borne out by the indicators. There was some divergence, which meant that a bounce was coming (we knew that cycles were bottoming in this time frame), but the oscillator has not yet been able to go through the longer trend line as well as becoming positive. It stopped fractionally above the zero line. The fact that it went past the former top is a positive, and the odds favor an extension of the rally whether or not there is a pull-back – unless the pull-back is so severe that it significantly alters the near-term price action. This is why next week is so important!
The Hourly Chart allows us to focus on the important aspects of the chart. Here, we can see that, at the low, the price actually went beyond both channels -- an indication of an oversold condition which is ripe for a rebound. Also, the indicator was showing some positive divergence (green arrow) at the same time that it was making a bullish cross of its MA.
Now, however, we have almost the same condition, but in reverse. The opening on Monday morning will make a lot of difference as to what comes next. If the market has a strong opening, it will erase the negative divergence in the indicator by moving through the 200-hr MA and probably the former short-term top of 1335 as well, and proceed to one of the projection targets indicated earlier.
If, on the other hand, there is a weak opening, then the index could re-test 1307, or even move lower before resuming the rally. Going below 1296 would be a negative, indicating that the bounce is most likely over, and that we are dropping into the cycles in the middle of the month (This is not the favored scenario).
Cycles
The cluster of cycles that we discussed last week as a potential time slot for a near-term low worked out well. And now? Have the cycles already exhausted their potential in light of what lies ahead? Perhaps not right away. There are some cycles slated for the middle of June which could turn out to be a market high, rather than a low. The real challenge for the market will probably come in early July if what I call the 2-yr cycle continues to repeat its historical pattern. If it does, this would be the best time for the SPX to secure an intermediate low.
Breadth
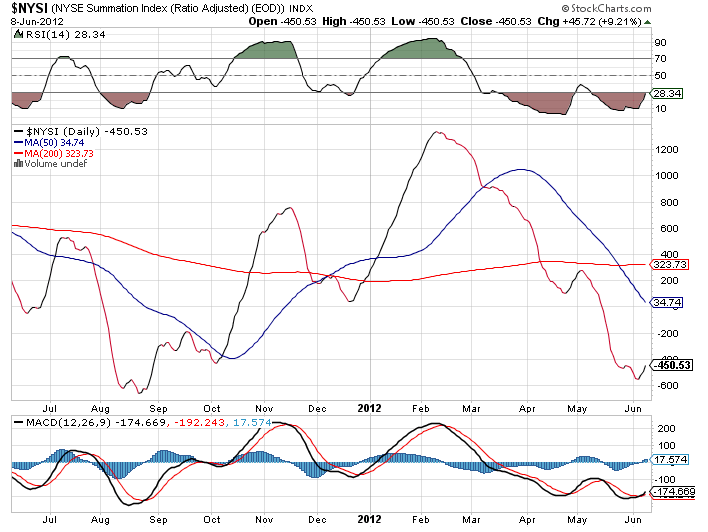
Steady improvement in market breadth has kept the NYMO above zero, and this has caused the NYSI to reverse its downtrend. The new pattern is still fragile and will most likely be tested over the next two to three weeks, when the 2-yr cycle bottoms. This test could result in producing the classic formation made by the NYSI at an intermediate market low: positive divergence, followed by a resumption of its uptrend.
Sentiment Indicators
The SentimenTrader (courtesy of same) long-term indicator is pretty much in the same place as it was last week. Perhaps a little less bullish. The one on which to focus right now is the short-term index, because it has moved a lot closer to giving a sell signal.
The VIX
VIX adds to the perception that we are about to get another near-term pull-back in the market. It developed some positive divergence to the SPX during the last few hours of trading on Friday. The indicator tends to confirm this.
Note, however, that the index has only broken a short-term trend line and is still in an uptrend until it moves below its former near-term low. If this does not happen shortly, it will reinforce our notion that we have not yet made an intermediate bottom.
XLF (Financial SPDR)
The XLF has risen all the way to the top of the former short-term high, which makes it slightly stronger than the SPX. However, the indicator is showing some negative divergence which tells us that, unless there is some strong upside momentum at Monday’s opening, it is likely to continue to consolidate along with the market.
Like the SPX, it did not show any deceleration at the last low, which means that it will probably retest its low or make a slightly lower low before a better reversal occurs.
BONDS
After making a new high, TLT stopped its climb in a “blow-off” move similar to what it did when it reached its 125 projection, finding resistance at the junction of two internal trend line parallels with divergence showing on the lower indicator. All this at a time when the SPX met one of its projection levels in a semi-climactic manner, and reversed.
It is now likely that TLT will make an intermediate top at its 133-134 Point & Figure target at the same time that an intermediate bottom is being established by the SPX and other equity indices. Just as the SPX will not have a significant reversal until it breaks out of its descending correction channel, TLT will not enter into an important correction until it breaks below the rising 21-DMA and the trend line which define its uptrend. For now, its first pull-back found support at the recently penetrated 125 top.
UUP (Dollar ETF) Daily Chart
It’s easy to see that UUP is in an intermediate uptrend which could be morphing into a long-term trend. After all, the index should be on its way to about 25 while the US dollar reaches its 90 base count, but don’t expect this to happen over the next couple of weeks.
UUP has just met – and even exceeded – a short term projection to 22.80, which denotes that there is probably enough upside momentum to take it to its next short-term projection of 23.30 -- “coincidentally” at the top of the present channel. This could come when the SPX tries to find an intermediate low around early July.
GLD (ETF for gold)
GLD may be in the process of completing an intermediate correction that has been in process for ten months. Its next low is expected to be in mid-June in conjunction with the 25-wk low. If it holds the 149 level, it will have built a base which may allow it to challenge the top of its declining channel. This could be the resumption of its long-term uptrend, but it will not be confirmed until it has risen above 174 -- the top of the February high.
A break-out into a new long-term uptrend does not appear to be right around the corner. The index will first have to build a P&F base large enough to reach its long-term projection of 233. There is still more work to do!
OIL (USO)
USO has been in a steep correction that has shaved off 25% of its value over the past three months with most of it occurring in the last month. But this should be coming to an end. The index had a projection of 30.50/31.00 and, with a low of 31.03 about a week ago, it should now begin to build either a base or a re-distribution phase which could take some time to complete.
The current count comes only from the distribution phase at the right of the top. If we extend the count across the entire area above the green line, we arrive at a projection which is 10 points lower. That would clip off another 25 percent from the top for a total of 50 percent. But this does not sound extreme considering that there is nothing bullish about the long-term chart. From its high of 119 in June of 2008, the stock dropped straight down to 23 in February 2009 and has gone essentially sideways since. The highest retracement it has been able to achieve was when it rallied to 45 in April of last year. That represented a rebound of exactly 23.6% of its total drop.
USO is very likely to break its 23 low and eventually end up somewhere around 8. But this projection, if correct, will only be reached in the Fall of 2014 when the next bear market comes to an end.
Summary
The SPX may be ready to extend its near-term correction before moving higher and completing its rally from 1267. The top is expected to be around 1343 and come in mid-June. After that, an additional decline should take hold which could lead to a marginal new low.
It is possible that 1329 will turn out to be the top of the rally, but it’s not the preferred scenario. Whether the index extends is correction or moves higher right away will be decided first thing Monday morning.
Andre
FREE TRIAL
HOW GOOD ARE YOU? I challenge you to sign up for an introductory, four-week subscription now, and compare your market forecasts to mine! I will e-mail on-going, intra-day market updates with comments and explanations, plus summaries of the daily action and a weekly report. My service is ideally suited for traders, but it is also valuable to longer-term holders since price projections will be provided to you through Point & Figure analysis (which pin-points the probable extent of market moves) along with best-time estimates obtained from cycle analysis.
ARE YOU AS SUCCESSFUL AS YOU COULD BE? Fear or your ego may be getting in the way. Verify your own research! You may happily discover that there is a service which is uncommonly dependable and also reasonably priced…called Market Turning Points.
The above comments about the financial markets are based purely on what I consider to be sound technical analysis principles. They represent my own opinion and are not meant to be construed as trading or investment advice, but are offered as an analytical point of view which might be of interest to those who follow stock market cycles and technical analysis.
=============
June 10, 2012
Market Turning Points
Week-end Report
By Andre Gratian
Precision timing for all time frames through a 3-dimensional approach to technical analysis: Cycles - Breadth - P&F and Fibonacci price projections, and occasional Elliott Wave analysis
“By the Law of Periodical Repetition, everything which has happened once must happen again, and again, and again -- and not capriciously, but at regular periods, and each thing in its own period, not another’s, and each obeying its own law … The same Nature which delights in periodical repetition in the sky is the Nature which orders the affairs of the earth. Let us not underrate the value of that hint." -- Mark TwainCurrent position of the market
SPX: Very Long-term trend – The very-long-term cycles are down and, if they make their lows when expected (after this bull market is over) there will be another steep and prolonged decline into late 2014. It is probable, however, that the steep correction of 2007-2009 will have curtailed the full downward pressure potential of the 120-yr cycle.
SPX: Intermediate trend – SPX is working on an intermediate low.
Analysis of the short-term trend is done on a daily basis with the help of hourly charts. It is an important adjunct to the analysis of daily and weekly charts which discusses the course of longer market trends.
Daily market analysis of the short term trend is reserved for subscribers. If you would like to sign up for a FREE 4-week trial period of daily comments, please let me know at ajg@cybertrails.com.
Market Overview
As anticipated in last week’s newsletter, which was entitled “MARKET LOW FORMING”, the indices did find a low on 6/04 and have been rising since. So far, the SPX has tacked on a quick 62 points, but may find the going a little tougher from this point on. Although Friday’s session was positive, the action looked tentative, cautious, as if the main players were sitting on the side lines ahead of the week-end. That could mean that they are expecting some news which may affect the market adversely. However, unless we see some significant weakness develop, this could turn out to be part of the consolidation which started on 6/09 and, when it’s over, we could go on to reach our intended target for this rally.
There are three potential projections. The most conservative is 1333. The next, which is moderate, is 1343. And there is an optimistic target of 1353. Since all of them exceed the high of 1329 which has already been reached, the odds favor a move past that level with the SPX deciding which target it wants to honor.
It is also possible that 1329 was “it” for now! At best, the SPX has only made a short-term low and it will have to do more work to turn it into an intermediate uptrend. This could entail expanding the current base, either by re-testing the former low of 1267, or even going beyond. Remember that there are still some unfilled projections from the top distribution pattern which call for potential lower targets -- perhaps as low as 1233. And since the daily indicators have not yet given a credible buy signal, the danger of exceeding the former low still exists. The near-term fate of the market should make itself known as early as at the opening, on Monday.
Chart analysis
As we do the majority of the time, we’ll start with the Daily Chart of the SPX. It’s easy to read and it gives us a good perspective on the market position. After correcting for a couple of months, the SPX found combined support from the lower channel line of the larger (blue) channel, the green line drawn across previous tops, and the bottom line of its short-term corrective (red) channel. That, in connection with the bottoming of several cycles pretty much ensured a rally.
However, there are remaining conditions which this rally will have to fulfill to continue. First, the SPX will have to overcome its previous high of 1335 and, although it has breached the decline’s short-term down-trend line, it will have to get out of the red channel before we can declare that a reversal has taken place. And there is something more subtle which suggests that this is more of an oversold bounce than a bona fide reversal. There is no visible deceleration in the decline! On its last down leg, the index went all the way to the bottom of the channel. My guess is that we will have to re-test that low and perhaps even go lower until some deceleration appears by its staying away from the lower line of the red channel. Until we see that, the odds that the market has made a low are questionable.

This analysis of the price action is borne out by the indicators. There was some divergence, which meant that a bounce was coming (we knew that cycles were bottoming in this time frame), but the oscillator has not yet been able to go through the longer trend line as well as becoming positive. It stopped fractionally above the zero line. The fact that it went past the former top is a positive, and the odds favor an extension of the rally whether or not there is a pull-back – unless the pull-back is so severe that it significantly alters the near-term price action. This is why next week is so important!
The Hourly Chart allows us to focus on the important aspects of the chart. Here, we can see that, at the low, the price actually went beyond both channels -- an indication of an oversold condition which is ripe for a rebound. Also, the indicator was showing some positive divergence (green arrow) at the same time that it was making a bullish cross of its MA.
Now, however, we have almost the same condition, but in reverse. The opening on Monday morning will make a lot of difference as to what comes next. If the market has a strong opening, it will erase the negative divergence in the indicator by moving through the 200-hr MA and probably the former short-term top of 1335 as well, and proceed to one of the projection targets indicated earlier.
If, on the other hand, there is a weak opening, then the index could re-test 1307, or even move lower before resuming the rally. Going below 1296 would be a negative, indicating that the bounce is most likely over, and that we are dropping into the cycles in the middle of the month (This is not the favored scenario).

Cycles
The cluster of cycles that we discussed last week as a potential time slot for a near-term low worked out well. And now? Have the cycles already exhausted their potential in light of what lies ahead? Perhaps not right away. There are some cycles slated for the middle of June which could turn out to be a market high, rather than a low. The real challenge for the market will probably come in early July if what I call the 2-yr cycle continues to repeat its historical pattern. If it does, this would be the best time for the SPX to secure an intermediate low.
Breadth
Steady improvement in market breadth has kept the NYMO above zero, and this has caused the NYSI to reverse its downtrend. The new pattern is still fragile and will most likely be tested over the next two to three weeks, when the 2-yr cycle bottoms. This test could result in producing the classic formation made by the NYSI at an intermediate market low: positive divergence, followed by a resumption of its uptrend.

Sentiment Indicators
The SentimenTrader (courtesy of same) long-term indicator is pretty much in the same place as it was last week. Perhaps a little less bullish. The one on which to focus right now is the short-term index, because it has moved a lot closer to giving a sell signal.

The VIX
VIX adds to the perception that we are about to get another near-term pull-back in the market. It developed some positive divergence to the SPX during the last few hours of trading on Friday. The indicator tends to confirm this.
Note, however, that the index has only broken a short-term trend line and is still in an uptrend until it moves below its former near-term low. If this does not happen shortly, it will reinforce our notion that we have not yet made an intermediate bottom.

XLF (Financial SPDR)
The XLF has risen all the way to the top of the former short-term high, which makes it slightly stronger than the SPX. However, the indicator is showing some negative divergence which tells us that, unless there is some strong upside momentum at Monday’s opening, it is likely to continue to consolidate along with the market.
Like the SPX, it did not show any deceleration at the last low, which means that it will probably retest its low or make a slightly lower low before a better reversal occurs.

BONDS
After making a new high, TLT stopped its climb in a “blow-off” move similar to what it did when it reached its 125 projection, finding resistance at the junction of two internal trend line parallels with divergence showing on the lower indicator. All this at a time when the SPX met one of its projection levels in a semi-climactic manner, and reversed.
It is now likely that TLT will make an intermediate top at its 133-134 Point & Figure target at the same time that an intermediate bottom is being established by the SPX and other equity indices. Just as the SPX will not have a significant reversal until it breaks out of its descending correction channel, TLT will not enter into an important correction until it breaks below the rising 21-DMA and the trend line which define its uptrend. For now, its first pull-back found support at the recently penetrated 125 top.

UUP (Dollar ETF) Daily Chart
It’s easy to see that UUP is in an intermediate uptrend which could be morphing into a long-term trend. After all, the index should be on its way to about 25 while the US dollar reaches its 90 base count, but don’t expect this to happen over the next couple of weeks.

UUP has just met – and even exceeded – a short term projection to 22.80, which denotes that there is probably enough upside momentum to take it to its next short-term projection of 23.30 -- “coincidentally” at the top of the present channel. This could come when the SPX tries to find an intermediate low around early July.
GLD (ETF for gold)
GLD may be in the process of completing an intermediate correction that has been in process for ten months. Its next low is expected to be in mid-June in conjunction with the 25-wk low. If it holds the 149 level, it will have built a base which may allow it to challenge the top of its declining channel. This could be the resumption of its long-term uptrend, but it will not be confirmed until it has risen above 174 -- the top of the February high.
A break-out into a new long-term uptrend does not appear to be right around the corner. The index will first have to build a P&F base large enough to reach its long-term projection of 233. There is still more work to do!

OIL (USO)
USO has been in a steep correction that has shaved off 25% of its value over the past three months with most of it occurring in the last month. But this should be coming to an end. The index had a projection of 30.50/31.00 and, with a low of 31.03 about a week ago, it should now begin to build either a base or a re-distribution phase which could take some time to complete.
The current count comes only from the distribution phase at the right of the top. If we extend the count across the entire area above the green line, we arrive at a projection which is 10 points lower. That would clip off another 25 percent from the top for a total of 50 percent. But this does not sound extreme considering that there is nothing bullish about the long-term chart. From its high of 119 in June of 2008, the stock dropped straight down to 23 in February 2009 and has gone essentially sideways since. The highest retracement it has been able to achieve was when it rallied to 45 in April of last year. That represented a rebound of exactly 23.6% of its total drop.
USO is very likely to break its 23 low and eventually end up somewhere around 8. But this projection, if correct, will only be reached in the Fall of 2014 when the next bear market comes to an end.

Summary
The SPX may be ready to extend its near-term correction before moving higher and completing its rally from 1267. The top is expected to be around 1343 and come in mid-June. After that, an additional decline should take hold which could lead to a marginal new low.
It is possible that 1329 will turn out to be the top of the rally, but it’s not the preferred scenario. Whether the index extends is correction or moves higher right away will be decided first thing Monday morning.
Andre
FREE TRIAL
HOW GOOD ARE YOU? I challenge you to sign up for an introductory, four-week subscription now, and compare your market forecasts to mine! I will e-mail on-going, intra-day market updates with comments and explanations, plus summaries of the daily action and a weekly report. My service is ideally suited for traders, but it is also valuable to longer-term holders since price projections will be provided to you through Point & Figure analysis (which pin-points the probable extent of market moves) along with best-time estimates obtained from cycle analysis.
ARE YOU AS SUCCESSFUL AS YOU COULD BE? Fear or your ego may be getting in the way. Verify your own research! You may happily discover that there is a service which is uncommonly dependable and also reasonably priced…called Market Turning Points.
For a FREE 4-week trial, Send an email to: ajg@cybertrails.comFor further subscription options, payment plans, and for important general information, I encourage you to visit my website at www.marketurningpoints.com. It contains summaries of my background, my investment and trading strategies, and my unique method of intra-day communication with subscribers. I have also started an archive of former newsletters so that you can not only evaluate past performance, but also be aware of the increasing accuracy of forecasts.
The above comments about the financial markets are based purely on what I consider to be sound technical analysis principles. They represent my own opinion and are not meant to be construed as trading or investment advice, but are offered as an analytical point of view which might be of interest to those who follow stock market cycles and technical analysis.
Subscribe to:
Posts (Atom)


