Showing posts with label Real Estate. Show all posts

Friday, April 22, 2011

Vanishing dollar helps hide it: Chart of the Day - Home prices down 38% since 2005 peak

Think real estate prices are starting to rebound? Want to know what a difference the vanishing-in-value dollar (a/k/a inflation) makes in the equation? First I'll show two monthly charts, one for IYR (a real estate ETF that's run up since 2009 like everything else), and the U.S. Dollar index ($USD) which looks like it's thrusting toward 66 (hmm, interesting number) after breaking down from a massive triangle. Then we'll see the "Chart of the Day" commentary and big-picture, long-term, inflation-adjusted chart showing how "real" home prices compare, from http://www.chartoftheday.com/20110422.htm

Here are the monthly charts of IYR and $USD:

And now, the inflation-adjusted chart from "Chart of the Day" - maybe home values solidify at support soon, if only for a sustained bounce (e.g., a big wave 2 or B up if you're longer-term bearish; which rebound along with a lower dollar simultaneously, would make many folks happy), before another potential leg yet lower down the road...?


Chart of the Day - Home prices down 38% since 2005 peakBookmark and Share
For some perspective on the all-important US real estate market, today's chart illustrates the inflation-adjusted median price of a single-family home in the United States over the past 41 years. Not only did housing prices increase at a rapid rate from 1991 to 2005, the rate at which housing prices increased -- increased. That brings us to today's chart which illustrates how the inflation-adjusted median home price is currently 38% off its 2005 peak. That's a $100,000 drop. In fact, a home buyer who bought the median priced single-family home at the 1979 peak has actually seen that home lose value (8.5% loss). Not an impressive performance considering that more than three decades have passed. It is worth noting that the median priced home is currently in the bottom half of a price range that existed from the late 1970s into the mid-1990s.

Notes:
- Should you invest in real estate or stocks? The answer may surprise you. Find out now with the exclusive & highly regarded charts of Chart of the Day Plus.


Rate today's Chart of the Day
Excellent 5 4 3 2 1 No good
By voting every day you help us get you the charts you want to see.


Quote of the Day
"It ain't over till it's over." - Yogi Berra

Events of the Day
April 22, 2011 - Good Friday - Earth Day
April 24, 2011 - Easter
April 27, 2011 - Administrative Professionals Day
April 28, 2011 - Take Our Daughters & Sons to Work Day - NFL Draft begins (ends April 30th)
April 29, 2011 - Arbor Day
May 01, 2011 - May Day


Mailing List Info
Chart of the Day is FREE to anyone who subscribes.
....
Journalists and bloggers may post the above free Chart of the Day on their website as long as the chart is unedited and full credit is given with a live, do follow, text link to the Chart of the Day homepage http://www.chartoftheday.com .... Chart of the Day is provided to subscribers without warranty of any kind and accepts no responsibility for its accuracy or for any consequences of its use.

Saturday, July 24, 2010

Hope and fear drive trading to where the wild rides are: Raymond Merriman's weekly preview

The markets continued their wild ride surprising many, as Raymond Merriman has been predicting several weekends now, with the sharp "crash-like" drops and manic rallies, and struggle once AGAIN to regain above 1090 and 1097. Fortunately between his previews, plus Andre Gratian's technical analysis, Tony Caldaro's Objective Elliott Wave bull/bear decision-pivot alternatives, we were prepared for a steep drop AND steep rally to occur at some point. Now what? We start our weekend as usual with Raymond Merriman's weekly preview. His perspective on the markets, economy, and even political climate is truly unique. He always has remarkable insights to share. We'll see what he's saying in his public comments this weekend, incorporating his cycles analysis with his financial astrology for equities, bonds, currencies and commodities - for commentaries that are always fascinating. Here's Ray Merriman's set of public preview comments for the upcoming week, from his site at Merriman Market Analyst MMACycles Weekly Preview Comments:
=============

MMA Comments for the Week Beginning July 26, 2010
Written by Raymond Merriman

Review and Preview


So this is how it is going to be. Wild. If you are a trader in the trenches every day, you know its wild. It is every bit as wild as Financial Astrologers feared and hoped. We feared it would be wild because if it lived up to its potential, there would be sudden and large price moves in many markets, causing this to be a very difficult market environment. It is the nature of Saturn opposition Uranus (July 26). It is the nature of Jupiter stationary retrograde in a waxing square to Pluto (July 23-August 3), as it is also remains in conjunction with Uranus in Aries.

 We also hoped it would be wild, for we wanted to see Astrology live - in real time - correlating with market movements reflecting these hugely diverse geocosmic dynamics. We may have also had a bit of sinister desire to see this market behavior mess with the minds of the world’s smartest people too, hopefully leading them to a little humility. Markets have a way of doing that. So does life. Whether you are a political leader, economist, Central Banker, trader, or unemployed worker trying to find a job that five other people want at the same time as you… it doesn’t matter. You are not in control now. You are deep within this “Twilight Zone” type of a portal known as the Cardinal Climax. It’s a different kind of reality. To navigate successfully in this terrain, one better be humble and admit, as the song “Tarrango” by Club des Belugas, croons, “I am not master of my senses. Therefore I cannot be guilty.”

 But you can be master of your senses. It’s just harder when Jupiter and Uranus are in Aries because you want it all and you want it now. And Saturn in opposition to both says “no.”

 Last week’s start of this fifth and deepest layer of the Cardinal Climax (July 21-August 21) began with an announcement by the FDIC (Federal Deposit Insurance Corporation) that six more banks have been seized by government regulators, bringing the total closed this year to 96. According to the Wall Street Journal, “The pace of failures has nearly doubled that of 2009 when 140 banks were shuttered by regulators.” The Cardinal Climax stories of today are signs of things to come. In many cases they reflect trends already in force, some of which started around the time Pluto entered Capricorn in January 2008. This is a celestial condition that will be in force through 2023, but is especially strong 2008-2015, and even more especially strong this month with Jupiter square Pluto twice in the next two weeks.

 Early last week, there were other leading articles of interest, given the nature of the Cardinal Climax. One headlined blared, “China Tops U.S. in Energy.” A day later, China actually tried to refute the report of their new world status. The same day, another article was titled, “New Gel Cuts Risk of HIV Infection.” Pluto is also healing. Yet other articles reflected the out-of-control world debt situation implied by Jupiter (exaggeration) square Pluto (debt), such as “Ireland’s Debt Rating is Downgraded” and “Hungary Battles IMF Plan” to put it on a tight budget, creating excessive risks via “excessive austerity measures.” Austerity becomes chic with Saturn entering Libra last Wednesday, July 21. Get used to it. This set up lasts until the election season of 2012. Then the debt and its attendant problems could increase dramatically once again as Saturn enters Scorpio, and Uranus begins its three-year dance of “The Waxing Square Tango” with Pluto.

 On July 21, the headlines proclaimed, “Housing Market Stumbles.” The article starts out by reporting, “In major markets across the country, home sales are deteriorating… and builders are cutting back construction plans.” That’s not just Saturn entering Libra, but the Moon’s North Node in Capricorn, headed for the extremely sensitive 0 degree Capricorn point in February-March 2011. That is technically (per principles of the Nodal Cycle) the bottom of the real estate market, give or take two years either side (15 Aquarius through 15 Scorpio, or September 2008 – July 2013). Maybe the bottom is when that lunar node in Capricorn squares Saturn (ruler of Capricorn) in Libra (September-October 2010), or conjuncts Pluto (all of November 2010).

 July 21 also had a headline titled, “U.S. Forces Set Up Pakistan Presence.” Shades of Uranus in Aries (2010-2019) and especially Mars conjunct Saturn, opposite Uranus (July 30-31)! Is there a big battle brewing? These are aspects of possible hostility and threats, especially as Mars squares Pluto on August 3, the same day Jupiter squares Pluto. That’s a lot of Mars and a lot of Aries energy. Mars and Aries have association with wars and military conflicts. Let’s hope leaders (and others) are in control of their senses, and don’t give in to impulse, for with Pluto in Capricorn, you are guilty and you will be held accountable for whatever you do on impulse.

 On Thursday, July 22, “Barack Obama signed into law the most sweeping overhaul of lending and financial rules (on Wednesday) since the Great Depression,” stated the Wall Street Journal. More regulations and more governmental agencies with regulatory powers to seize more banks. “Regulators will have to be vigilant,” Obama warned. You betcha! So will bankers. Pluto is in Capricorn! And on Friday, July 23, the Wall Street Journal hit on two other hot topics due to create a stir. The first was “Senate Halts Effort to Cap Emissions.” The second article was about the expiring Bush tax cuts coming up. Secretary of Treasury Geithner and the White House want the tax cuts to continue for everyone except the wealthiest of Americans. But several members of Congress, including many within the President’s own party, are now taking a stand to permit the tax cuts to continue for everyone. A big fight over taxes is yet another Pluto theme.

 And how did stock markets react? Well, the previous Friday, July 16, the DJIA was down 261 points. On Monday July 19, it was up 57 points. On Tuesday it was down nearly 150 points early on, but rallied to close up 75 points. On Wednesday it continued higher until Fed Chair Ben Bernanke testified before Congress that the economy is “unusually uncertain.” Bingo! Big Ben gets it. The DJIA fell 200 points following his remarks. Is Congress listening? Yet the next day, Thursday, it opened with a bang and closed up over 200 points. Friday was up another 102 points, to its highest level in a month, as European Banks passed their version of the “stress test.” You think you are in control? Not in this new portal of reality where things change at “Uranus-in-Aries” lightning warp speed. You can only survive if you are humble. And I didn’t even mention the Shirley Sherrod story. Google her. You better be humble, because if you blog, speak, or fire someone too impulsively about something like “racism” (now there is a hot Uranus-Pluto topic) before getting the facts straight, you will be forced to learn humility fast.

 In other markets, grain prices continued to soar as hot weather helped drive prices to their highest levels in months. Gold and Silver were down to the lowest level in several weeks through early Tuesday, but then staged impressive rallies into the Sagittarius Factor of Wednesday and Thursday. By Friday, everyone was weary and ready for the weekend break, and they sold off.

 Welcome to the first week of the deepest month of the Cardinal Climax.

Short-Term Geocosmics

This is the time band Financial Astrologers have been waiting for. We are in it now. It is unlike anything we have ever experienced. During this one month period (sign of Leo), there are four major planetary cycles unfolding that have a cyclical periodicity of 13-45 years.

On Saturday, July 24, the 13-year waxing square of Jupiter and Pluto takes place. Since Jupiter turns retrograde at this time too, it will square Pluto a second time just ten days later on August 3. This is a signature that implies exploding world debt (again), as well as the potential for large losses due to natural or man-induced disasters (it has an orb of a few months, but could relate to the crisis in the Gulf of Mexico, as well as a drought). On July 26, the fifth and final passage of the 45-year Saturn opposition Uranus aspect will take place. You may remember the first time this happened on November 4, 2008 (the USA Presidential election). You may also remember the last passage of this same aspect on April 26, which still stands as the yearly high in many world stock indices, including the USA.

On August 16, the second passage of the 20-year Jupiter-Saturn opposition will take place, which also refers to major changes in the direction many world governments. And finally, the third and last passage of the 32-37 year waning square between Saturn and Pluto takes place on August 21, which has correspondence to world-wide government debt, much like Jupiter square Pluto does. The difference between Jupiter-Pluto square versus Saturn-Pluto square is that the former wants to attack debt by increasing spending (i.e. economic stimulus programs, ala Keynesian economic principles), whereas the later wants to attack the exploding debt by cutting back on spending programs (i.e. austerity measures and economic contraction).

Most of this period is contained within the boundaries of the tropical zodiac sign Leo (July 21-August 21). It will thus have a geocosmic impact upon all Leo-born natives (like President Obama) because this Cardinal T-square (the “Cardinal Climax”) will be in effect on their birthdates. In the study of astrology, the chart of the planets on your birthdate each year is known as a “solar return chart”, and describes the nature of conditions one is likely to experience for the year. But it will also affect every individual who is born around the first four days of each season (approximately March 21-25, June 21-25, September 21-25, and December 21-25). Why? Because their natal sun will be in the very degrees that these major planets are crossing in the next month (0-3 degrees of cardinal signs). For many of these individuals, this will probably be a powerfully transformative period of life. Be humble, think clearly, and avoid impulsive decisions.

But what does it mean for financial markets? Long-term cycle tops and/or bottoms may take place now. Perhaps we will see the high or low of the year in some markets, or at least a reversal from a multi-week cycle crest or trough that will quickly lead to new highs or lows for the year. We can identify 14 separate and important geocosmic signatures unfolding July 23-August 9. Many of these have contradictory themes. Thus this period is likely to continue being fraught with sudden and sharp rallies, and just as sudden and sharp declines. Now stocks are rising into this time band, which fits the most likely geocosmic scenario issued to MMA Cycles subscribers in a special report early this week. We may witness huge ranges on some days, perhaps 500-1000 points in the Dow Jones Industrial Average, and maybe 200-500 points in Silver. This possibility could even extend into the second passage of Jupiter conjunct Uranus in mid-September.

Longer-Term Thoughts

 I have run out of room to say much in this section. But I do note with interest that I received some very fine letters regarding my thoughts on Capitalism last week. All these letters were from people on the West Coast (Oregon and Washington), which probably don’t know one another. All suggested that Capitalism ended in 1913-1914, probably with the passage of the Federal income tax bill. All mentioned that instead of Capitalism, we have been practicing a type of economy that is more like “Corporatism.” And one person suggested that Pluto in Capricorn is not the “death march of Capitalism,” as I questioned last week, but rather the “death march for Socialism.”

 Did I mention that during the Cardinal Climax there may be instances of brilliant, out-of-the-box, ideas? Especially with Uranus in Aries? Let’s get through this month… this portal… “Don’t stop just yet. We got the world looking in. Our window.” Morcheeba ("World Looking In").

 
Announcements

If you are an active short-term trader, you may be interested in our Weekly or even Daily Market reports with short-term trading recommendations. It is the only way I keep in touch with traders on a daily or even weekly basis, as I no longer offer personal consultations. These reports give in-depth analysis of the DJIA, S&P and NASDAQ futures, Euro currency (cash and futures), Swiss Franc, Dollar/Yen cash and Yen futures, T-Notes, Soybeans, Crude Oil, Gold and Silver. The daily reports cover all stock indices listed above, as well as futures in Euro, T-Notes, Soybeans, Gold and Silver. Subscription to the daily report also includes the weekly report. For more information, go to http://www.mmacycles.com/services, or call our offices at 1-248-626-3034. In the words of one of our subscribers: “I recently subscribed to your weekly report and am finding it to be excellent and a very useful companion to the MMA Cycles Report.  I can't imagine now managing my investments without them.”

CD’s DVD’s, MP3’s, and “On-Line Streaming Video” of the July 11 webcast are now available!!! Each of these various ways to see the event can now be ordered via our website at www.mmacycles.com (just click the opening banner), or by calling 1-248-3034 or email operations at ordersmma@msn.com. The cost of each is $45.00, plus postage if necessary. This webcast covered our outlook for stocks, precious metals, interest rates and Treasuries, foreign currencies vis-à-vis the U.S. Dollar, and Grains. We pick this time because it is right before the astrological midpoint of the Cardinal Climax, which takes place late July through early August. It may be the peak of the huge trend reversals expected in many of these markets, aided and abetted by major changes of trend in geopolitical matters. You won’t want to miss this presentation. Order now, because most of the trading opportunities presented are in effect from July 21 through October 8, 2010!!!

Any remaining copies of the Forecast 2010 book will be available for $30.00 (plus postage), now as long as supplies last. This year’s book was an incredible publication, as almost everything forecasted in it has come out as described. All the themes outlined, and almost all the financial markets are unfolding as indicated with one exception: there has (as of yet) been no sign of excessive speculation in stocks or precious metals. Instead, frightened investors are flocking to U.S. Treasuries. Everything else, however, has been spot on, and there is still time for this to happen in stocks and precious metals into mid-2011. We now offer a complimentary copy of this year’s book to any new or renewing subscriber of a one-year subscription to the MMA Cycles Report, our new MMA European Cycles report, or any subscription to a MMA daily or weekly report, as long as books are still available. See special offer on the opening page of www.mmacycles.com.

The monthly MMA Cycles Report and its companions – the MMA Japan Cycles Report and MMA European Cycles Report – came out this week, Monday and Tuesday, via posting on our web site, and attachment via direct emails, for subscribers. W also sent an update to subscribers on Wednesday. If you subscribe to these reports and did not get them, let us know at once. This report covers our longer-term analysis of the U.S. stock market, precious metals, crude oil, currencies, Treasury Notes, and grain markets. The MMA Japan Cycles report covers the Nikkei, JGB Bonds, and the Dollar-Yen. The new MMA European Cycles Report covers the German DAX, Swiss SMI, and Netherlands AEX, each in English only. New yearly (or renewing) subscribers to these reports will receive a free copy of the Forecast 2010 book while supplies last (see below). For subscription information, please go to SERVICES at www.mmacycles.com.

I am oftentimes asked for recommendations of a money manager who uses my methods, since I won’t manage other people’s money. That is especially true now with the volatility in the market place as of late. The thing is, almost all money managers I know use their own systems. But many subscribe to my services and share my thoughts about the future of the economy, various financial markets, and how to position one’s portfolio along these lines. One money manager who subscribes to our services that I would suggest for those looking to structure a longer-term portfolio, such as a retirement account, is Duke O’Neill of Capstone Capital Wealth Management, Boulder, Colorado. He can be reached at dukeoneil1@gmail.com, or 1-(303) 247-0600. For those looking for a professional trader of commodity and futures contract might consider Ted Lee Fisher at ted.fisher@comcast.net. Ted is a legend in financial futures and has a seat on the CME. Both are very knowledgeable of the tools I use, of the way I am looking at markets, and yet each makes their own decisions as to exactly when to enter and exit any market.

September 23-26, 2010: Buenos Aires! Seminar on Financial and Mundane Astrology with Raymond Merriman and others, with special emphasis on Argentina’s Merval Index and precious metals and whatever else is of interest to participants, for each Financial Astrology workshop is different. For more information, contact Claudia Rizzi at astrologycr@gmail.com, or visit our web site at www.mmacycles-spanish.com. If you only speak Spanish, go to www.astrologiamundana2010.blogspot.com. We may host a special gathering of MMA Subscribers at the end of the seminar, depending on interest expressed.

October 1-2, 2010: Rio de Janeiro! Workshop on Financial Astrology with Raymond Merriman, plus a Mundane Astrology panel with Merriman and others. The workshop will have with special emphasis on Brazil’s Bovespa Index and precious metals, and whatever else is of interest to participants. For more information, contact Renato Chebar at astrologiafinanceira@gmail.com. We will host a special gathering for MMA Subscribers on Sunday, October 3, the day of Brazil’s elections!!!

January 5, 2011: Forecast 2011! Speech and live webcast from Birmingham, MI. Details to be announced soon.

January 14-16, 2011, Zurich, Switzerland. “Forecasts 2011” symposia featuring top mundane and financial astrologers, plus one day workshop on Financial Market Timing with Ray Merriman, to be followed by a special meeting with MMA Subscribers (at no cost). For more details, go to www.astrodata.ch.

March 10-12, 2011: Mexico City, Mexico. Speech on Forecasts 2011, and workshop on “Evolutionary Astrology: The Journey of the Soul Through States of Consciousness.” For information, please contact acuario888@gmail.com.

September 1-8, 2011: Bali! "Financial Astrology" Intensive workshop with Raymond Merriman, and "Mundane Astrology" with Claude Weiss. For more information on this unique week-long intensive and incredible South Pacific paradise adventure, go to http://www.heavenandearthworkshops.com/financial.html.

The MMA Catalogue of products and services for 2010 is available for download in PDF at http://www.mmacycles.com/option,com_docman/task,doc_download/gid,161/Itemid,63/. The ordering page is the last page of the catalogue. This is especially useful for those outside of the USA, since we do not send these by snail mail unless requested.

Disclaimer and statement of purpose:
The purpose of this column is not to predict the future movement of various financial markets. However, that is the purpose of the MMA (Merriman Market Analyst) subscription services. This column is not a subscription service. It is a free service, except in those cases where a fee may be assessed to cover the cost of translating this column from English into a non-English language.

This weekly report is written with the intent to educate the reader on the relationship between astrological factors and collective human activities as they are happening. In this regard, this report will oftentimes report what happened in various stock and financial markets throughout the world in the past week, and discuss that movement in light of the geocosmic signatures that were in effect. It will then identify the geocosmic factors that will be in effect in the next week, or even month, or even years, and the author’s understanding of how these signatures will likely affect human activity in the times to come. The author (Merriman) will do this from a perspective of a cycle’s analyst looking at the military, political, economic, and even financial markets of the world.

It is possible that some forecasts will be made based on these factors. However, the primary goal is to both educate and alert the reader as to the psychological climate we are in, from an astrological perspective. The hope is that it will help the reader understand these psychological dynamics that underlie (or coincide with) the news events and hence financial markets of the day.

No guarantee as to the accuracy of this report is being made here. Any decisions in financial markets are solely the responsibility of the reader, and neither the author nor the publishers assume any responsibility at all for those individual decisions. Reader should understand that futures and options trading are considered high risk.

Copyright MMACycles 2007; you may link to this site or page, but you may not distribute these texts in any way (by email or otherwise).

Archives
Previous weeklies (2006) are archived at www.olmta.com

For other language editions of MMA´s weekly comments:
Dutch : www.markettiming.nl (Nederlands)
Spanish : www.mmacycles-spanish.com (Español)
German : www.mma-europe.ch (Deutch)
Japanese : www.merriman.jp
Russian : www.urania.ru
Serbian : www.mma-balkan.com
Polish : www.astrobiznes.pl

Friday, April 23, 2010

Chart of the Day - Single-family homes priced in gold have plunged 75%

Many people realize that home values have really slipped. But thanks to the price of gold bottoming approximately the year 2000, home values measured in gold are actually much lower than you might realize. The folks at Chart of the Day are showing this today at http://www.chartoftheday.com/20100423.htm

Below is their information on this:
=============
Chart of the Day - Single-family homes priced in gold have plunged 75%
Today's chart presents the median single-family home price divided by the price of one ounce of gold. This results in the home / gold ratio or the cost of the median single-family home in ounces of gold. For example, it currently takes 153 ounces of gold to buy the median single-family home. This is considerably less that the 601 ounces it took back in 2001. When priced in gold, the median single-family home is down 75% from its 2001 peak and remains well within the confines of its five-year accelerated downtrend.


Rate today's Chart of the Day
Excellent 5 4 3 2 1 No good
By voting every day you help us get you the charts you want to see.


Quote of the Day
"Gold is forever. It is beautiful, useful, and never wears out. Small wonder that gold has been prized over all else, in all ages, as a store of value that will survive the travails of life and the ravages of time." - James Blakely

Events of the Day
April 30, 2010 - Arbor Day
May 01, 2010 - May Day - Kentucky Derby
May 04, 2010 - National Teacher Day
May 05, 2010 - Cinco de Mayo (Mexico)


Chart of the Day is provided to subscribers without warranty of any kind and accepts no responsibility for its accuracy or for any consequences of its use. Journalists and bloggers may post the above free Chart of the Day on their website as long as the chart is unedited and full credit is given with a live link to Chart of the Day at http://www.chartoftheday.com.

Sunday, January 24, 2010

Bearish on real estate - or REITs? Watch for a bounce (or more) from nearby support first

The ETF called IYR attracted lots if selling volume the past two days. I checked into this chart because of my recent post about the Chart of the Day feature chart and comments on real estate. But is the recent volume an interim capitulation before another bounce? On my weekly chart, there's Fibonacci support for IYR at $43.36. And a Fibonacci goal at $50.69. The area being tested now is also previous swing high price support. So it's possible it'll bounce soon (even if it becomes right to go bearish again later).

I can't guarantee IYR will push above $50, but I think it's worth trimming in shorts here or possibly playing for a bounce, or more. A target at $50.69 could be worth it. Conversely if it breaks under $43.36 then IYR wouldn't look so good. But since it remains over $43.36, IYR may surprise to the upside. At least in the near term. If it plays along, then consider partial profits on a retracement (such as 50% back to the recent highs), while leaving some in for the speculative possibility of IYR pushing to $50.69 (with a stop just under $43.36).

Friday, January 22, 2010

Real estate which rang bell on 2007 peak, concerning again as REITs break below support:Chart of the Day

Real estate is just as much a canary in the coal mine, as the banks are. So this news from "Chart of the Day" looks concerning. I'm not going to give up on the possibility of equities poking a new high later this year. Just as they made a later high in 2007. But for now, when the trend is down, it doesn't hurt to take a look at this info on the REITs - since real estate plays such a central role in our economy's health:

=====
January 22, 2009
Chart of the Day - REITs break below supportBookmark and Share
While the market has rallied sharply since March 2009, some sectors have begun to break below support of their post-crisis uptrend. One such sector is the all-important real estate sector. For some perspective, today's chart illustrates the current trend of the Dow Jones Wilshire REIT Index. While REITs have been trending up sharply for ten months, REITs currently trade 50% below their February 2007 peak. As today's chart illustrates, the Dow Jones Wilshire REIT Index has just broken below support (green line) of its upward sloping trend channel.

Notes:
- The market is at a critical juncture. Where we go from here may surprise you. Find out right now with the exclusive charts of Chart of the Day Plus.


Rate today's Chart of the Day
Excellent 5 4 3 2 1 No good
By voting every day you help us get you the charts you want to see.


Quote of the Day
"Don't confuse brains with a bull market." - Humphrey Neill

Events of the Day
January 31, 2010 - Grammy Awards - NFL Pro Bowl
February 02, 2010 - Groundhog Day


Chart of the Day is provided without warranty of any kind and accepts no responsibility for its accuracy or for any consequences of its use. Journalists and bloggers may post the above free Chart of the Day on their website as long as the chart is unedited and full credit is given with a live link to Chart of the Day at http://www.chartoftheday.com
.

Tuesday, December 29, 2009

Equities indices still make higher highs as questions mount about bearish signs

As Gerald Celente, a forecaster, was just on Fox Business tonight predicting the "Crash of 2010",* the S&P 500 made another spike high this morning only to fall down again this afternoon. I'd thought it might trace out an intraday triangle, preparing for a thrust up to 1133 or maybe a bit higher tomorrow or Thursday. That doesn't look like the pattern, but it's still making higher highs and higher lows day by day, as you can see on the SPX 15-minute chart below. Remember this index is dancing just above its 50% retracement to its October 2007 high. So if and when it drops back under that level (which I've got noted as 1122, and some mark it for the SPH at 1126), it can be legitimate to treat it from the bearish perspective unless it rebounds above it again. So, its path from here really is important.

Speaking of triangles, look at the TLT weekly chart, below. I know Tony Caldaro has Treasuries marked as making a "C" wave down, and I'm on board with that. But it needs to break under $86 to confirm (for TLT). It will be interesting if it's working out a triangle that pushes upward instead. So far, the indicators are consistent with a standard triangle and don't guarantee a breakdown under the mid-2009 lows.

Another weekly chart that relates to the equity and bond markets, is IYR (an ETF for real estate), below. It's just tagged a .618 retrace level to a prior swing high on that weekly chart. If it can push higher, there's a 50% retrace level to its all-time high, slightly over $50. Either way, it's clear that IYR is vulnerable at these levels and can be subject to a trend reversal. Buying volume is shriveling up. On a reversal, the question will become whether a turn down will be merely corrective or point to new lows. There are some who argue that real estate may continue down into 2012, and perhaps well beyond.

So - this is once again a time to see these key markets as being at important levels. How these markets move from here will say a lot about what we can look forward to in 2010.

* For our own views for 2010, we're looking at how the SPX reacts here, but willing to go along with the ideas described in prior posts here about higher levels into mid-January, with the idea of weakness for a couple of months after that. And then, the possibility of higher highs in May and/or August, followed by a real crash ... Of course, if the SPX drops back under 1122 and can't rebound back above it, that will be more immediately bearish. Will see! And obviously will fine-tune as we go.

Tuesday, December 15, 2009

Housing index in bearish mode fits the idea of a low in 2012

A post I made earlier this evening mentioned real estate and showed the IYR, a real estate ETF that's still doing okay so far. But my overall view of housing and real estate is bearish, candidly. I've got to agree with the views of Martin Armstrong in his late November newsletter. Namely, it's got a long way down still to go. Armstrong actually forecasts an interim low in the year 2012, then up into 2016, then down again until something like 2030 or 2033 (I don't recall the year). What about Tony Caldaro's Objective Elliott Wave? I've borrowed from his public charts (thanks again Tony!), for the housing index. Tony's marking on those charts, below, shows that the housing index took about 3 years to drop in wave ABC (normally completing a "W" in regular Elliott Wave). Tony marked an X on its recent high. That implies the housing index is downtrending in its next big wave down.

Obviously it can have subwaves up and down meantime. Also, it's one thing to say that teal estate and home values ate dropping, and another to chart an index of homebuilder company stock values, which may travel differently. But my basic point is this: The real estate industry and land/home values should act as a drag on the economy for a long time still. The recent nice bounce helped, no doubt. But having this sector roll over again should be considered for trading this sector defensively, as well as kept in mind for the undertow it can create for banking in particular and equities in general.

If you can like the banking index, your stomach is stronger than mine!

The banking index ($BKX, also the ETFs KBE & KRE) sagged down some more today. Not unexpected at all, given the bearish harami about a week and a half ago. Looking at the selling volumes on the KBE chart below, it's evident others are seeing it bearishly too. I haven't found an ETF that goes inverse to the $BKX so it seems a matter of shorting the KBE and/or KBW, or using options plays with them.

By contrast, look at the IYR (real estate ETF, chart below). It's managed higher despite some real selling volumes about a month ago. But is it going higher, or topping out? The answer could affect banks. Well I'm inclined to look for real estate to complete its rally crest - so I'm watching for trend reversal signs. The indicators are still in decent shape so I'm thinking it's a matter of time and we'll have to keep watching for that.

Sunday, December 6, 2009

Weekend review - technical analysis and related observations on the financial markets

Folks, each weekend we like to review what other analysts are saying about the markets. This weekend holiday preparations are leaving me less time to do much other than simply list a batch of the most helpful or interesting. That's not to say there aren't more out there that we'd add if some more time's available. But you'll do well with these at least!
This weekend's Terry Laundry's T Theory Observations by Terry Laundry at http://www.ttheory.com/
You'll want to check out his charts and audio that go with this:
Update for Sunday December 6 2009. Today I have expanded the 1966 to 2009 basic A-D T chart presentation to include all important Ts detailed in the tutorials in order to answer some reader questions and better put the big picture more clearly into perspective. I had planned to answer some detailed technical questions today but I am postponing them until next week.

As usual look at the first PDF Chart then listen to its Audio Commentary. You should be able to have the chart visible while the audio is playing.


Technical Market Report by Mike Burk at Safe Haven, http://www.safehaven.com/article-15204.htm

Another set of interesting blogs and site articles:

Check out the "Mr Topstep" market commentary and analysis videos at Youtube, they're expecting 1130-1150+ by year end although they tend to focus on daily or short-term setups so that is subject to change. Find them by following at Twitter, http://twitter.com/MrTopStep.

Swing traders may be interested in free access to Carl Swenlin's service for most of December; you can decide if it's helpful. I do think his swing approach works just fine for KI$$ approaches to investing, actually. At http://www.decisionpoint.com/prime/dailycharts/dailymenu.html.

Tim Wood of Cycles News & Views writes about housing this weekend, at both Financial Sense and at Safe Haven. He's showing technical signs of a small downleg into spring 2010. http://www.financialsense.com/Market/wrapup.htm.

Here's the link to Tim Wood's article on Housing at Safe Haven, at http://www.safehaven.com/article-15206.htm
If you read Marty Armstrong's Nov. 26 newletter, you know he projects a real estate low in 2012, then a bounce for a few years, then way, way down into - well, I think it's somwthink like 2033!
Anyway, Tim's article is a good read. And Tim also adds:
I have begun doing free Friday market commentary that is available at www.cyclesman.info/Articles.htm so please begin joining me there. The specifics on Dow theory, my statistics, model expectations, and timing are available through a subscription to Cycles News & Views and the short-term updates. I have gone back to the inception of the Dow Jones Industrial Average in 1896 and identified the common traits associated with all major market tops. Thus, I know with a high degree of probability what this bear market rally top will look like and how to identify it. These details are covered in the monthly research letters as it unfolds. I also provide important turn point analysis using the unique Cycle Turn Indicator on the stock market, the dollar, bonds, gold, silver, oil, gasoline, the XAU and more. A subscription includes access to the monthly issues of Cycles News & Views covering the Dow theory, and very detailed statistical based analysis plus updates 3 times a week.


Daneric's Elliott Wave blog is showing some VIX/SPX charts that would go along with Tony Caldaro's new 1158-1168 target area for the SPX. At http://danericselliottwaves.blogspot.com/.

This weekend's Monday Morning Outlook: Bulls Slow Pace as We Approach End of Year, at Schaeffer's - http://www.schaeffersresearch.com/commentary/observations.aspx?ID=96651:
There was no shortage of drama last week -- fallout from Dubai and Black Friday, and a far better-than-expected unemployment report. The Dow Jones Industrial Average (DJIA) responded by climbing 0.8%. Looking ahead, Todd Salamone, Senior Vice President of Research, examines several technical resistance levels on the S&P 500 Index (SPX) and concludes we might be stuck in a short-term trading range. Next, Senior Quantitative Analyst Rocky White takes a closer look at the implied volatility skew on S&P Depositary Receipts (SPY) exchange-traded fund options, what that might tell us about hedge fund activity, and why that might signal a short-term pause in the market's bullish trajectory. Finally, we wrap up with a look at some key economic and earnings reports slated for release this week.

Last for now but NOT least, at Bill Luby's VIX and More: New Dr. Brett Series on Lessons for Developing Traders - a blog post about this, by Bill Luby, at his http://vixandmore.blogspot.com/2009/12/new-dr-brett-series-on-lessons-for.html
This is a MUST READ. Consider it the best holiday gift you can give to (and invest in) yourself!

Tuesday, December 1, 2009

Deciphering some clues on whether markets are breaking or faking, for making bulls' or bears' fears

Neither bulls nor bears always get what they want, or can avoid what they fear. Did today represent a last gasp or the start of a new breakout? Thinking on this made me also recall one of Ray Merriman's comments that the markets would likely make some surprise moves that might seem like a breakout or breakdown, then turn out to be faking instead of breaking. But which is it? Meanwhile on the bigger picture, trader Joe pointed out that Martin Armstrong has issued a new newsletter 11/26/09, "The Sum of All Fears: A Great Depression" at http://www.martinarmstrong.org/files/The-Sum-of-All-Fears-A-Great-Depression-11-26-09.pdf. Based on the cover note you might want to download and save your own .pdf copy of it right away.... One of the points he makes is that the stock market high should be in 2012 or 2016. That should bust some bears, representing their worst fear - since many bears project lows for those time periods! While I've had a hard time projecting a final high for that time frame, that's based on my concerns about time frame and maybe I need to review (and could see it more easily for 2016 I'll admit). Overall that's compatible in my view with the idea of the Elliott Wave (EW/OEW) flat, depending in part on whether we count the 2007 high as a B or a large III and how to count the waves down to the March low. Tying into T Theory is another matter too. Would fit kinda neatly if there's a low in 2010 or 2011 and then allow five years for a final wave "V" high. Can't say I've got "the answer" yet on what path the SPX will take but it's fascinating to work out.

Do read Armstrong's newsletter if for no other reason than to see his forecast for real estate (very bearish!), and explanation of wealth shifting from non-movable assets to movable assets.

Meantime below are charts starting with daily and weekly showing the US dollar index ($USD) overlaying gold (in gold color of course) and the Dow Jones Industrial Average equities index (in blue). You can see that gold vaulted to get just beyond the $1192 level, while the dollar and Dow edged up so close to their prior extremes that they look like they want to push farther. But is that the fake-out? Or was it that major extreme last Thursday when US markets were closed and now the markets seem acting as though nothing happened? Near-term, we just work with the levels (and thanks to Andre, Tony and Terry who provide great input in their respective analyses updates!). Terry Laundry tonight agrees there isn't a breakout confirmed but takes note that the A/D edged higher, and also notes the obvious monthly cycle currently that suggests a high in mid-December. (Locate his T Theory site in the list at right, then navigate to his daily update page).

So let's let the levels tell us whether, or not, the markets haven't finished the rally yet. As close as they edged today, they didn't confirm. The shape of the SPX and Dow right now remind me of another boxy top made by oil when it topped, but given the TRIN and CMF money flow as I showed in the prior post earlier this evening - I'm just not ready to bet that the indices have quite finished the top yet. So we'll give it at least another couple of days to reveal.

Wednesday, November 11, 2009

Phil Davis of Phil's Stock World suggests we're partying like 1999 - and his charts say he may be right

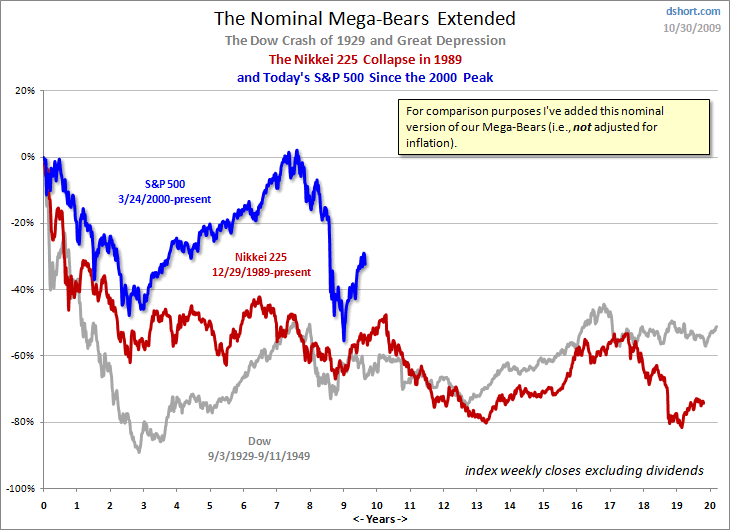
After all this, and a "mere" 50% retrace by the Dow to its 2007 peak, is it really just another 1999-like speculative bubble? Yes, it's very possible. Check out this article by Phil Davis - Options Trader Wrong-Way Weekly Wrap-Up: Party Like It's 1999, at Seeking Alpha, http://seekingalpha.com/article/172112-options-trader-wrong-way-weekly-wrap-up-party-like-it-s-1999. I think he wrote it several days ago but I'm most interested in his big-picture outlook. The charts he shows in this article include a very sobering one of real estate home values as they skyrocketed far above decades-long averages and still haven't dropped much. Also he shows comparisons of the current bear to historical bear markets. I'll include one as a quote below, but read his full article to see how he inflation-adjusts it and discusses it. You'll see why I think Phil has a lot of good insight, even if his Phil's Stock World is mainly for fast-moving options traders. (Though there are areas for swing traders too.). This particular set of comments - if you see through it past the yikes! and humor and focus on the long-term - has some good messages for all folks even if you're not actively investing any portfolio. Here's just a quote to piqué your interest:
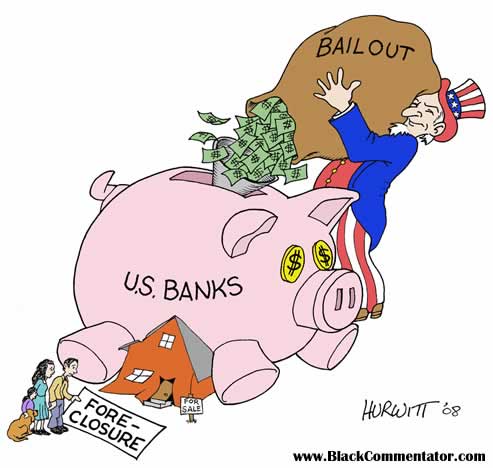
This [easy mortgage financing system] allowed Americans to go from promising to pay 2.5 times their annual salaries in 1997 to 5 times their annual salaries for the same exact home in 2007. Again, it's one of those fantastic industries where you can just keep charging people more and more money without giving them anything more that you used to make. By repackaging home ownership as in investment vehicle, clever realtors and mortgage brokers were able to convince Americans that diverting all of their potential savings into a mortgage payment made economic sense. This plan was aided and abetted by the media and Wall Street, who clamored to tell you that Social Security would be bankrupt and you could not possibly save enough money to retire on unless you either put it into housing or put it into the stock market, causing a massive bubble in both.
That's just one of the reasons why there are economic and financial "disconnects" that - I think he's saying - continue to threaten real recovery. Anyway, below is one of his comparison charts, and a cartoon depicting his point about banking bailout imbalances - funny but sad! Now check out his full article for yourselves. And as for his market views - I think they're about what we are seeing, that we are at another major test of where the markets will carve a direction for coming months.


Tuesday, October 20, 2009

Real estate sector subdued by news, ready to roll over for another move down

Sobering "news" about housing starts and building permits supposedly helped take down the markets today. Now, anyone who knows anything about the housing market is aware that activity picks up in the late spring and summer, then slows again into late fall and winter. And anyone who understands the pace of the housing market and is aware of what's going on, realizes the slowdown is going to last a really, really, really long time. Is all that priced in already? I'm convinced it isn't priced into home prices yet. What about in tradable markets like $HGX or the IYR exchange-traded fund (ETF)? I've been considering the 50% retracement I've marked on the IYR weekly chart, below, as a B wave level, after it broke over the downtrend channel lines to make a serious B wave - meaning, now ready to continue lower again in a C wave (a 5-wave movement in EW terms). You can see in the IYR daily chart (top chart below) that it was already faltering before today's "news".

At the bottom I've borrowed Tony Caldaro's Objective Elliott Wave chart of the housing index $HGX (from page 3 of his public charts available from his site - link above, and always at the right side of the page here - thanks again Tony!). I see that Tony's marking that as having finished an X wave. In the EW that I know, that implies Tony is expecting a 3-wave ABC movement down, and I'd expect that to dig to a new low, same as the C wave I've been expecting, would do. Bottom line? Look for a trend change to play out leading real estate to lower levels (and don't be surprised if it drags other sectors down too).

This bearish view will be wrong (and stops should be exercised to stop put of shorts) if it strengthens again, and makes new swing highs. Assuming the bearish view holds, it can be played with SRS or whatever a trader prefers, looking for continuation moves lower.

Saturday, September 26, 2009

Chart of the Day is reminder of ongoing drop in core asset - home prices

It seems many markets may classify bearishly as completing, or already completed, a "b" wave up that positions them for lower levels. The housing and real estate markets look like they fit into this description. Below is my weekly chart of the real estate ETF, called IYR, showing that it's turned down after testing its 50% retracement to an interim 2008 swing high with the sharp rally. Slightly higher are $48.38 which would retrace 61.8% back to that, and $51.18 that would retrace 50% back to IYR's all-time high. It's possible that IYR can struggle higher to at or slightly above $52 before finishing. The 50% level, in addition to being a Fibonacci number, is also a classic amount for an Elliott Wave "b" wave to retrace. NOTE - the IYR price has already reached a symmetry of the second rally leg to the first part of it (so it can be a symmetrical ABC). If it falls under $37 before making a new high, it's mostly likely finished already. Otherwise, if it does make new highs, then the $48.38 and $51.18 areas would likely finish it.

Also below is a chart and discussion from "Chart of the Day" with a bearish-looking outlook on home prices. What does all this imply?

That the decline by real estate off the recent rally top is either the first step down in a move that will retest and likely fall beneath the lows. Or that it's a temporary pullback before making one more higher wave up, before it's ready to roll over. Either way, not something that whets the appetite of position investors. Nor does it make me want to run out and buy actual real estate on the theory that "it's bottomed and this is the best time to buy."

Remember that the "Chart of the Day" uses inflation-adjusted dollars. Of course, what this also implies is that if the dollar actually rises (shock!), then the realized current values will get dragged down by that deflationary factor alone. That's one reason why the "Chart of the Day" looks even more bearish than the charts people normally use for understanding real estate prices.


Chart of the Day - Home prices resume decline
September 25, 2009
Today, it was reported that the median price of a single-family home dropped 2.3% in August. The stock market sold off on the news. For some perspective into the all-important US real estate market, today's chart illustrates the US median price of a single-family home over the past 39 years. Not only did housing prices increase at a rapid rate from 1991 to 2005, the rate at which housing prices increased – increased. That brings us to today's chart which illustrates how housing prices are currently 30% off their 2005 peak. In fact, a home buyer who bought the median priced single-family home at the 1979 peak has seen that home appreciate by a mere 4%. Not an impressive performance considering that three decades have passed. Over the past two months, single-family home prices have resumed their decline and remain (until proven otherwise) in an accelerated downtrend.

Chart of the Day is provided without warranty of any kind and accepts no responsibility for its accuracy or for any consequences of its use. Journalists and bloggers may post the above free Chart of the Day on their website as long as the chart is unedited and full credit is given with a live link to Chart of the Day at http://www.chartoftheday.com

Thursday, September 17, 2009

Toll Brothers CEO selling - should you?

There's news tonight the Toll Brothers CEO sold more stock, bringing the year's total over $80 million. Here's part of how Schaeffer's summarized the day: "On one side, the bulls cheered news that the number of U.S. workers filing for unemployment benefits unexpectedly declined during the latest week, as well as data indicating that business activity in the Philadelphia region expanded to levels not seen since mid-2007. On the other side of the Street, however, the bears bucked up after housing starts increased by less than forecast last month, and big caps FedEx Corp. (FDX) and Oracle Corp. (ORCL) reported disappointing first-quarter figures.". Below are some of my charts of IYR and $HGX, and Tony Caldaro's chart of $HGX. Is it time to sell? Perhaps! But Tony's count implies we will first see the rally complete at higher levels.

Bottom line right now: be careful, it's weaker but may not be ready for shorting longer term .....yet. But don't be a complacent either - watch indicators and would be a good idea to keep an eye on Tony's count. You can find his charts at his OEW site in the list at right.

I included my Fibonacci retrace chart, in case this does turn out merely a B wave bear market rally. If right, a C wave down short be a good short when it's ready.

Tuesday, July 21, 2009

Juxtaposition of events places equities markets under a cloud again

Today we've seen the VIX once again testing the 24.78 level as VIX futures expire, and the VIX doesn't look convincing that it wants to remain under 24.78. At the same time, the Nasdaq Composite index ($COMPQ) moved just above the 1912 Fibonacci level I've spoken of here before, and quickly moved under it again today in a possible intraday bull trap door (i.e., a bearish pattern (it "traps the bulls"). Now it's even possible that the Nasdaq Composite is working on a bearish engulfing bar on the daily candlesticks. These alone are bearish indications for the equities markets, as the Nasdaq Composite may drag down the other indices, but there are also some other factors that add to the mix. These include the dollar having poked a slight new low, but rising intraday; the euro doing the opposite; and even the yen moving up from a possible swing low. Gold is looking weak, and even Goldman Sachs and other financials are looking shaky as Blackrock is down after a disappointing earnings report and a discussion about the weak real estate market. Not surprisingly, the real estate index is also off. The retail sector holder (RTH) is looking like a possible bearish engulfing, and have you noticed the banking index ($BKX) down today too?

Some of these items are definite bearish indicators, and others are just items I've posted about here recently with the indication that turning points from here can be concerning. Does this mean that the bear market rally is definitely over, without the S&P 500 having tagged the $961 area we and others have mentioned? Of course it's a bit early to say, but the clouds have formed with the juxtaposition of these events. For that matter, it remains possible for the VIX to close relatively low, and for the S&P 500 index still to tag about $961 before a possible turn with the VIX doing the same from 24.78.

Obviously the SPX would have to move back above the intraday swing high of 954 to retain the potential of tagging the 961 area, so that's a level to consider for the time being.

My SWHC is also down which is disappointing of course, and will have to see if it can separate from the broader markets the way that the biotech sector (ya-a-ay!) seems to be doing so far.

TLT, the US Treasuries bond ETF, is moving up above yesterday's candlebody, so if taking a KI$$ approach long with this ETF, then a stop just under yesterday's low seems reasonable. If the juxtaposition of events does lead to further weakness in equities then maybe at least some will "get their wish" with higher bond prices and lower bond rates.

As I've cautioned in a tweet today, don't get "wedded" to any particular Elliott Wave count or head-and-shoulders pattern now (whether "bullish" or "bearish") - these cautionary flags are based on long-term Fibonacci levels at least for equities, the dollar, and the VIX. As such, these do have good potential to produce turning points. The near-term ambiguity of the Elliott Wave count (which by the way, is definitely a clue that we ARE in a correct pattern of some sort, and not a new bullish impulse!) can lend itself to different interpretations, which is exactly why these Fibonacci levels are like guiding stars. The fact that they are coming together today also lends this message more significance.

The yen might have made an important low. If so, then it needs to remain above yesterday's low, and I'm going to treat it as such unless and until it says something different. Meaning, if it goes under yesterday's low, I'm going to view it as being in jeopardy of losing support and going to much lower levels. It really can only re-establish that the yen is bullish by moving above the recent swing highs around 107-108 ($XJY chart).

As for the euro, I would believe it's rather clear that if the dollar strengthens from here, that's bearish for the euro. It seems strange if the dollar AND the yen strengthen from here. But, if for some reason that happens, then perhaps that's even more bearish for the euro.

Where does gold fall out with these possibilities? I'm stepping as carefully as I can with gold ... if it can strengthen above $958/960, that places $990 back in sight. Conversely, if gold drops, I'm thinking that will make itself obvious.

Sunday, July 12, 2009

Real estate (commercial), Residential real estate, and REITs: Three "R's" confirming Recession far from over?

Will the real estate sector pull us down again? Analysts are beginning to talk about commercial real estate being the next shoe to drop (hmmm, are these many shoes dropping from a centipede?! LOL) that can explain another round of weakness in banks, especially regional banks. As well as real estate in general on the verge of completing a counter-trend bounce that will roll over to another leg down. An interview on Bloomberg TV just a short while ago this evening featured the growing problems in commercial real estate. And another one yesterday featured one of the new online services that basically helps people "barter" their homes by trading their house for someone else's house. I tried to find that online service with a Google search, but turned up so many hits that I don't know if I can find it - but it's obvious this idea is growing in popularity. I've already commented a few times in the past that I think the convergence of bartering, and the Web with cheap or free online services, will be part of the deflationary force as we enter closer to the long-wave downturn lows still ahead. The good thing is that the Web enables the free exchange of communication that will help people weather the downturn lows relatively well - with information (learn how to cook and avoid expensive restaurants! exchange your home if you cannot sell it and buy another! keep up with family and friends online and save the old costs of photography, shipping packages, etc. etc.!).

So whether we welcome these new technologies as being part of deflationary forces, or as devices to help us get through deflationary times more easily, we've got to recognize that one of the sectors that's still in a downtrend is real estate, including commercial real estate.

The folks at "Chart of the Day" weighed in on this with their weekly free chart, so let's take a look - it's below, along with their text commentary:
Chart of the Day
For some perspective on the all-important US real estate market, today's chart illustrates the 2004 to 2009 trend of the Dow Jones Equity REIT Index. As today's chart illustrates, the unwinding of the real estate/credit bubble initially (early 2007 to mid-2008) occurred at a fairly moderate pace. That pace accelerated (mid-2008 to early 2009) as major financial institutions began to collapse. When all was said and done, the peak to trough decline of the Dow Jones Equity REIT Index ended up being 75.8%. Since the trough of early 2009, REITs have rallied and are currently up 38% (though remain 66% below the 2007 peak). As today's chart illustrates, the Dow Jones Equity REIT Index remains within the confines of a moderate downward sloping trend channel and currently trades near resistance.

Chart of the Day is provided without warranty of any kind and accepts no responsibility for its accuracy or for any consequences of its use. Journalists and bloggers may post the above free Chart of the Day on their website as long as the chart is unedited and full credit is given with a live link to Chart of the Day at http://www.chartoftheday.com/.

Well it's pretty evident that if the REITs fail from the resistance line shown on that chart, and if commercial real estate pulls down the banks some more ... and furthermore, the higher vacancy rates and the lower rents being negotiated are another clue that the overall economy is continuing to weaken, and there's no recovery in sight for residential real estate ... You cannot fault me for seeing these as signs that the financial markets outlook continues to be bleak!

Below is my weekly chart of IYR, which I constructed about a couple of months ago. Today I added some comments for this post. This also explains why my stake in SRS (short real estate) has been doing all right over the past two months. Given how things are looking, I do not see any reason to let go of that unless it reverses and takes out its lows of two months ago; and we should keep an eye on the IYR chart to see if it takes out the upper trendline resistance. Right now, IYR is riding on its Bollinger Band midline with moving average support, so it could bounce again to test that trendline. Taking out the moving average support will of course signal that another test lower lies ahead.

Wednesday, July 1, 2009

Mid-week reading of interest on the markets (ChartsEdge map below)

The ChartsEdge daily map for 7/1 is posted below (in an earlier post, last night here). And, I posted a few minutes ago at my UBTNB3 blogspot (links at right) a view of oil showing that both WTIC and USO are at levels suggesting they may well roll over to much lower levels, but still remain poised at a crossroads, suggesting they could try to move to higher levels - so we have to wait for confirmation.

Meanwhile, a few other comments, and then some suggestions for reading on the markets. The McClellan Oscillator either remains, or is trying to remain above the zero line for NYSE and Nasdaq, although it did set back yesterday - not surprising given the action, plus it's conveniently a pullback from the downtrend resistance line I've been marking on the McClellan charts. There are some indicators looking better in equities markets, but they don't guarantee that these markets can do better than a corrective bounce before rolling down to deeper levels. The dollar looked better but still at a low level showing that it isn't quite ready to break out (and to many eyes probably looks like it's threatening to break yet lower again), so it still needs to be watched closely. Treasury bonds moved into a resistance level so although they are looking like they put in their low, they'll need to remain above support (recent swing low) on a pullback. Gold is threatening to just fall down out of its channel support. So, we'll just have to see whether the markets can continue to levitate for another couple of days.

I've recently posted some articles of interest at my UBTNB3 blogspot, so I don't want to repeat those here - you would have seen them already by looking at the "feed" indicating those, at right. These are some items I've found interesting across the blogsophere or web. But just don't take them as indicating where the markets necessarily go. They're just to remain informed of some of the interesting analysis and news out there:

Baltic Dry Index Stuck in a Holding Pattern (Bespoke Investment Group, 6/30/09) (includes a chart showing this).

Would You Buy This Stock? (Bespoke Investment Group, 6/30/09) - Depicts the declines in housing prices, and discusses new ETFs that track this. Personally, I'd be careful - this can be due for a bounce at some point, and just the fact that ETFs can be used to hedge the decline makes me think that a bounce may be getting closer. (Although I agree that housing price declines are far from being over, should take years to work out.)

FAS Is Now XLF (Bill Luby at VIX and More, 6/30/09) - analyzes how the drop in volatility has affected the 3x leveraged ETFs including FAS (and profited those who've been selling options). The FAS did not actually become XLF, it just doesn't have more volatility than XLF by now, as he shows with charts.

Gruma Says ‘Doubt’ Will Continue as Going Concern Bloomberg (6/30/09) - Sign of the times, as Mexico's largest maker of the products used for corn tortillas says it may go under, due to losses from currency derivatives that plunged in value after the peso lost 20 percent in the fourth quarter of 2008.

House Price Crash Rate Finally Beginning To Ease (Henry Blodget at ClusterStock (at BusinessInsider.com), 6/30/09) - reviews the declines and rate of declines in housing prices.

Americans Suckle On The Government’s Teat - Courtesy of Joe Weisenthal and Kamelia Angelova at ClusterStock (at BusinessInsider.com), Posted at Phil's Stock World June 30, 2009 - Shows the increase over the past two decides in the percentage of U.S. personal income that comes from government transfer payments (welfare, unemployment, etc.).

"An Even Worse Financial System Than the One With Which We Began" - Yves Smith at Naked Capitalism, 7/1/09.

AIG: Ready to Blow Up Again - Financial Ninja (6/30/09) - AIG is making additional disclosures in connection with a regulatory filing updating "risk factors" in its 2008 annual report. These involve valuation declines on derivatives (credit-default swaps) sold to European banks.

NYSE Halts Transparency, Feels Goldman Program Trading Disclosure Is Unnecessary; and The NYSE Responds to Zero Hedge (both by Tyler Durden at Zero Hedge, 6/30/09) - Mentions the July 14 date that's interesting because it also lines up with the only remaining significant Bradley turning date before the late autumn.

Wednesday, June 24, 2009

Stay vigilant according to Dow Industrials' relative weakness and Elliott Wave counts

Although there may be reasons to look for higher levels tomorrow and/or Friday based on cycles and seeing the Nasdaq relative strength, the relative weakness of the Dow Industrials plus the probable Elliott Wave count signal traders to remain vigilant for the downside. If we are facing a third wave down as the next move, as we are thinking is the right count, then the odds of a gap down tomorrow morning are greater now. The P&F (Stockcharts.com's default settings) show Dow 8000 and SPX 850 as targets. Both look just slightly under the levels that would be symmetry targets if this would instead count out as an "abc" pullback. But those levels would also remain above the P&F chart support levels. If and when we get there, we'll be considering whether those are completing the pullback move, or merely a third wave, etc., with implications for a deeper test of the March lows.

Besides, there's the Bradley model that suggests an important low on Friday. The Bradley model may be working well this summer.

As the dollar strengthened this afternoon while the euro weakened, this can also be consistent with a near-term bearish outlook for equities.
Today the Fibonacci levels worked well - the calculations I'd provided were from the Friday afternoon swing high rather than intraday high, but as conservative levels worked out well for intraday longs with the map into the morning high in SPX. Others had also been mentioning the 912 level based on chart resistance, moving-average or other technical analysis methods. This also looks consistent with being small first and second waves within wave 3 down based on Tony Caldaro's SPC count, which looks good to me. It's because of this count that prospects for a gap down in the morning are increased. Gaps are most likely to occur during third waves (and C waves, which have much in common with third waves).

In sectors, retail and real estate still look heavy, and biotech still is maintaining above its 20-day moving average. Swimming against the tide is difficult but I like the biotechs' relative strength.