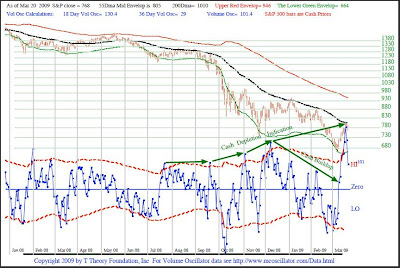
Today we saw the S&P 500 go above his 55-day moving average to about 823. I'd recently mentioned numbers at 830 and 838, but also worked out a level at 824 when looking at the SPX chart today. I'm hesitant to lean on this level too much because it's based on a c=a measurement and I cannot be 100% certain that we are looking at a c=a three-wave movement when others are deeming it to be a 5-wave. Still as I mentioned in a chart I posted this afternoon (either here or at my UBTNB3 site - it was a busy afternoon!), there's also a gap fill at or a bit above 824. With ChartsEdge issuing their alert, and Terry putting out his update, it's worth stepping back a bit to measure out where things stand. Interesting that the VIX and CPCE did not poke lower especially at the end of day while the SPX spiked higher.
I did look at the SPX chart with a view to seeing whether someone can make the case that today was a trigger pattern up for buying a swing long today. But in my opinion, the volumes from March 6 through today don't give an all-clear to view it that way. And with the other things going on, I don't feel that's the right call to make on today's action. Let's take a look at the McClellan data - here are the charts, courtesy of DecisionPoint.com:

The summation index for both NYSE and Nasdaq are both giving good signals for the longer time period out, but the oscillators for both are also showing the indices appear overbought. You can even see that they weakened some in the past few days, and even with the spike in price today they didn't show a corresponding spike in the oscillators. It's a small negative divergence, but could be the beginning of something more.
The VIX may be hinting the same. After dropping in the morning, VIX spend the rest of the day consolidating and then a quick move up at the end of the afternoon:
The TRIN may not be quite to a turn signal but close. TRIN did similar to the VIX intraday, except not as much of a push up at the end of the afternoon (see below). A turn up in the TRIN on an hourly basis and then daily basis will be more of a signal to expect more weakness.

This is a challenging market because many including us saw the potential for a continuation move higher ... but if the big move today doesn't give more continuation the rest of this week, then we'll have a lot of folks that were buyers today who may give us a new resistance level if the SPX moves under the lows of Thursday-Friday last week. There should be a lot of eyes on the 830 and 838 levels I've mentioned, and if the SPX gets above 875/877 then 884 is the next logical well-known place to look. (These are likely in addition to the pivot levels that have been mentioned by Andre Gratian and Tony Caldaro.) Whenever a meaningful turn comes then we'll mark off Fibonacci retrace levels for that, but first we'll have to see if any consolidation or pullback falls under the Thursday-Friday lows of last week.


No comments:
Post a Comment