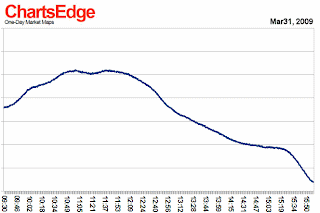
 Market Map for Mar31
Posted: March 31st, 2009
Author: Mike Korell
Filed under: One-Day Market Map
Submit Comments [to ChartsEdge on this post] »
=============
Thanks once again, Mike and ChartsEdge!
I know that it's one thing for the cycles to indicate a high or low, and another to determine which it is (high or low) - Mike's system was certainly right about existence of a gap Monday morning! So he certainly deserves a nod for that, and we cannot be upset that the direction of it was different than forecast. For that matter, we don't know if that amazing news about GM yesterday didn't throw a wrench into all kinds of systems yesterday! And with all that went on yesterday - and even remembering that the ChartsEdge forecasts are to be used for timing of highs and lows, not absolute levels, I've got to say that yesterday's intraday map did another phenomenal job of forecasting the intraday action.
From the original chart for the entire week, I would have thought that the market might close that gap from yesterday morning, and then we'd see if it trended downward again after this week. Of course that still may happen, either this morning or in the next day or so - cannot guarantee anything or rule anything out. But it is possible that the problematic factors seen in the charts going into and during last week, may be borne out with the fundamental factors being reviewed once again in the "news".
Apparently some talking head or analyst on tv said that when the market goes up, it will go up faster than anyone can imagine. Well, I see that possibility too, but it's only a possibility, again no guarantees! It is likely that whenever we see a bottom to this entire big wave down from October 2007, we'll see a recognizable wave 1 up and then wave 2 down, and then it will be the resumption upward from that which we'll want to hop aboard. We'll know it from a number of factors, including technical indicators and trendlines. Thinking about the entire possibility may just get us off-track for the current market, so let's focus on what's at hand nowadays. And we've got our 833/838 level as a nearby "line in the sand," along with the other good pivots and levels from Andre, Tony, and others. And the possibilities also include the market seeing new lows first, as well as pushing up in a rally for some weeks and then rolling over to new lows. All reasons to take it one day, and one week, at a time here.
Well, we'll see of course - so as always, be careful out there, and happy trading!


No comments:
Post a Comment