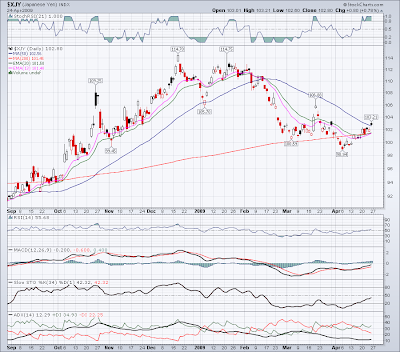
Looking at the daily chart below, it's evident from just a simple chart reading that if it moves above 106, or especially 106.88, then it can be expected to move higher because it will have broken above the swing high of late March. Its bounce from the 200-day moving average (similar to its bounce from its 50-week moving average) does look bullish, especially as it traveled above its 50-day moving average yesterday. If the potentially significant time window that's occurring this weekend means that it reverses down, then we'll obviously have to see whether it can remain above its 200-day moving average. But if this time window was already "met" by the jump yesterday, then we might expect to see it continue up. I'm not sure how to read the time window, but it is evident that the $XJY chart position looks positive especially if it remains above its 20-day and 50-day moving averages. (Meaning that the dollar-yen quote would fall lower, even under .80 if my idea works out of the $XJY moving to higher levels above 120).
On my monthly chart, you can see that $XJY has remained in an uptrend channel (it could even have poked lower and remain within it). What does this mean for the dollar? Well, I already posted yesterday another look at my chart of the dollar. I think it can remain possible for the dollar still to move up - and maybe that means $XJY reverses down again - for a while, into the end of May. But if the dollar decides to break under its channel I showed again yesterday, then that may be another signal that $XJY wants to continue moving up without a reversal down in this time window.
At least we know to be alert right now, and even into early May. After that, if my charts are on the right timing track, then we may need to take another in-depth look at the end of May.


No comments:
Post a Comment