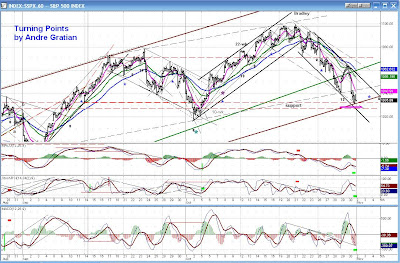
I'll have to admit something up front - looking at his channel trendlines for the drop from the high, I keep getting the feeling that it may have completed a full 5 waves down for a first wave, rather than having finished only 3 of 5 waves down as Tony Caldaro has stated in his OEW update. This is because of the way the wave is contained within a parallel downtrend channel with 3 touches on the lower line that can represent the ending points of waves 1, 3 and 5. (Well, actually it fell a bit short of touching the lower channel line on Friday, but close; and maybe Andre's comments about his projection would get it done if the SPX touches a bit lower tomorrow or Tuesday.) Hmmmm. Nothing that needs to be decided right now - and for that matter, I've learned to give great deference to Tony's wave counting. Either way, the implication is that the SPX is due for a bounce rally soon. Sounds like that concept is consistent with what Andre is seeing too.
So - let's see what Andre has in this weekend's update!
=============
November 1, 2009
Week-end Report
Turning Points
By Andre Gratian
Current position of the marketA 3-dimensional approach to technical analysis
Cycles - Breadth - Price projections
“By the Law of Periodical Repetition, everything which has happened once must happen again, and again, and again -- and not capriciously, but at regular periods, and each thing in its own period, not another’s, and each obeying its own law … The same Nature which delights in periodical repetition in the sky is the Nature which orders the affairs of the earth. Let us not underrate the value of that hint." -- Mark Twain
Long-term trend - Down! The very-long-term cycles have taken over and if they make their lows when expected, the bear market which started in October 2007 should continue until 2014. This would imply that much lower prices lie ahead. This will not be a straight-down decline, but a series of intermediate-term rallies and declines until we have reached the low point.
Analysis of the short-term trend is done on a daily basis with the help of hourly charts. It is an important adjunct to the analysis of daily and weekly charts which discusses the course of longer market trends.
Daily market analysis of the short term trend is reserved for subscribers. If you would like to sign up for a FREE 4-week trial period of daily comments, please let me know at ajg@cybertrails.com
Overview:
The SPX may have ended wave C! Although we reversed the trend just a few points from the 1109 target and subsequently closed below the lower trend line of the wedge pattern, we won’t have a confirmed intermediate potential downtrend until the SPX breaks below 1020 and makes a lower low.
Last Friday was a very weak day, closing down 30 points at 1036.19, only 6 points from the 1030 target for this phase. Intraday reached 1033.38, and created a little positive divergence on all 3 hourly indicators (below).

This divergence, as we approach the projected target, may be alerting us to the end of the current phase. We appear to need one more small wave down to about 1030 to complete the structure of the last wave from the 1066 top, and this would also complete the larger pattern from the top reversal point at 1101.36.
The daily indicators (chart below (under the SentimenTrader gauge)) have entered an oversold level from which they frequently reverse, and they show some divergence as well.
And being near a reversal point is fully supported by the SentimenTrader, (chart shown below courtesy of SentimenTrader). Both the short-term and the long-term indicators are bullish, something that we have not seen since the July low (B) and which should alert us to the possibility of making a short-term low at this level, instead of just a rally in a decline with more weakness to come.

Looking at the Daily chart and its indicator, we see that if we do make a low on Monday and get enough of a rally to get above 1066, it is possible for the SPX to come back down and test the low one more time by November 13 without breaking 1020, and then rally to a new high after the cycle has made its low.

We are at a juncture where things are a little murky and technical readings will have to clarify themselves over the next few days. We need to allow for various possibilities and let the market tell us what path it wants to choose.
The deciding factor for the near term is whether or not we trade below 1020 as we make our cycle low on 11/13. In that case, we should probably look for a price target of (about) 981 before the next reversal.
Since the dollar chart (below) suggests that it is making what could be a significant bottom, and that strength in the dollar has meant weakness for equities, it could be the catalyst for what the SPX does next.

If the dollar needs to do some additional basing, it will allow the SPX to move a little higher before reversing. On the other hand, if it continues its break-out move, it will send the SPX to the 981 projection.
Andre


No comments:
Post a Comment