Right in this Bradley turn date window, crude oil has tested up to the $91.52 level in WTIC that represents the Fibonacci 50% retracement to the prior all-time peak which I've been describing. Now that it's made this level, traders need to be alert for reaction. I've come to join those long-term bullish on oil (and see Tony Caldaro's two charts at bottom, on oil and natural gas - thanks again, Tony!), so the basic idea is that it'll push higher. But given the choppy advance, the Fibonacci level in this turn time window, and the overall weak economy, it's reasonable to expect a reaction that goes into a consolidation or correction. My daily and monthly charts of $WTIC are below, and the indicators are consistent with the possibility of a pullback.
It'll be bullish if oil pulls back, then returns to turn this Fibonacci level into support. But for now, we should respect that it's likely to represent a resistance level.
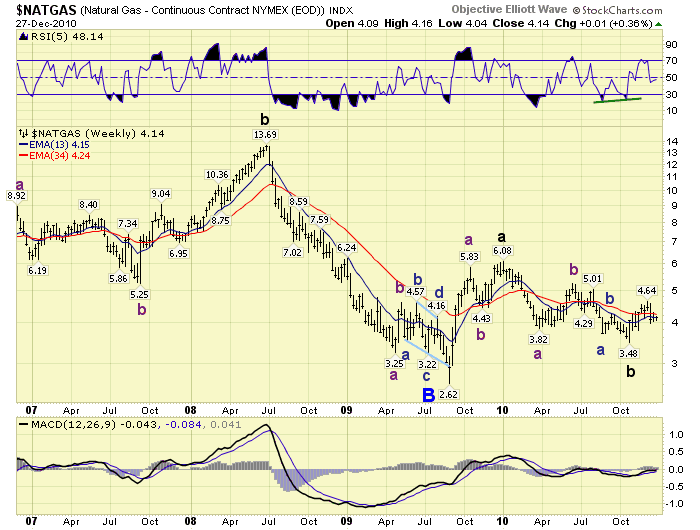
Tony Caldaro's charts, shown at bottom, suggest that both oil and natural gas have higher wave counts ahead. It's almost easier for me to see it in natural gas, since I could almost see the oil wave counts more bearishly (like a huge b-wave bear flag) - that's part of the reason for my issuing this post.


No comments:
Post a Comment