=============
January 23, 2011
Market Turning Points
Week-end Report
By Andre Gratian
We are currently witnessing the evolution of the SPX short-term trend from 1173 toward an eventual short-term top. When it ended the first phase of its intermediate uptrend from 1041 to 1226.40, the index had a correction which created a Point & Figure base that projected a total count of 1312. Until proven otherwise, this remains the objective for the top of the current short-term trend.
That P&F base was divided into phases which all yielded interim counts. As stated in last week’s newsletter, all the interim counts have been filled, except 1301. Minor consolidations or corrections occurred after each count was met. The one which took place after the 1275 projection was reached created a small re-accumulation phase from which it is also possible to derive counts. As usually happens, re-accumulation phases provide counts which tend to confirm the base count. In this case, the entire phase (heavy blue line) yields a count of 1310 --
very close to the 1312 base count. Another valid way of taking this count gives us 1308.
The SPX has already gone slightly beyond the interim count of 1294 and started another near-term correction which is still in progress. If this remains an interim correction, when it is completed, the index will have a final move to about 1310 and end the entire short-term phase from 1173. If the price dips below 1262, it could mark the start of an extended short-term downtrend.
The Hourly Chart indicators gave a buy signal when the near-term trend found support at 1271 -- the intersection point of several trend lines. After a good bounce on Friday, the index turned down again, but the indicators have not yet given a sell signal. If the price continues to dip, it will again find support around 1277 from the same trend lines. If they are penetrated and Friday’s low is broken, the SPX will have to remain above 1262 if we are to resume the uptrend into the higher projections. If it does not, there is a good chance that 1296 will turn out to be a short-term top with lower prices ahead.
The daily indicators need a little more work before being in a buy condition. Until they are, there is a risk of additional market weakness.
Dollar
The dollar ETF (UUP) has now been stopped three times by its 200-DMA. The last two times, it was not repelled nearly as much as it was the first time. Its current pattern looks more like the formation of a base between its recent low of 21.91, and its rally to 23.52.
The top indicator has reached oversold status, but the MACD, which is still dropping sharply, does not show any deceleration -- much less positive divergence. I interpret this to mean that the correction is not complete. In fact, the dollar index P&F chart indicates a potential low of at least 77. Since Friday’s close was 78.13, it has a little over a point to go before finding good support. This should give the SPX the time and incentive to rise to its final destination of about 1310.
Gold
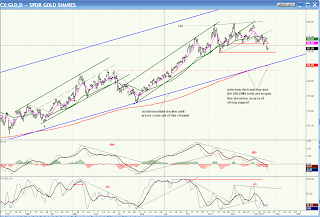
GLD filled an important count when it reached 139, formed a bearish terminal pattern, and has now started to correct. By breaking the first support level of 132, the index has triggered a near-term P&F projection to 129, which is the area of the second – and more important – support level. Should that level be penetrated to the downside, the index would then have a projection of 121, with the possibility of dropping as low as 110.
Since a bounce is likely from the 129 support, this may affect the P&F count, so the above projection may be subject to revision.
Also, note how the lower intermediate channel line and the 200-DMA have become one! It will be a sign of significant future weakness if that trend line is broken.
Overall market perspective
Because of evident cross-currents, we are currently in a period of uncertainty about the short-term market direction.
After surpassing its 2007 top, the QQQQ looks as if it made a classic terminal climactic thrust to 57.75 from which it backed off immediately. On Friday, this was followed by the breaking of a 6-week trend line. Although its intermediate and long-term trends are not threatened, this index looks as if it is done, for now.
The RUT also looks as if it has made a short-term top; it has just broken a 5-month trend line.
At the same time, on Friday, the DJIA made and closed at a new high, and would now have to close down more than 120 points to give a near-term sell signal. It would have to drop nearly 300 points to give a short-term sell signal.
In the midst of all this, the SPX looks neutral.
The sentiment indicators are also mixed. The VIX has started to move up, but not yet conclusively. The SentimenTrader, if anything, has become more bullish for the market. Take a look!
Because of this uncertainty, I need more time to see which way the SPX wants to break. The State of the Union address could be a positive factor.
Andre
The above comments about the financial markets are based purely on what I consider to be sound technical analysis principles. They represent my own opinion and are not meant to be construed as trading or investment advice, but are offered as an analytical point of view which might be of interest to those who follow stock market cycles and technical analysis.


No comments:
Post a Comment